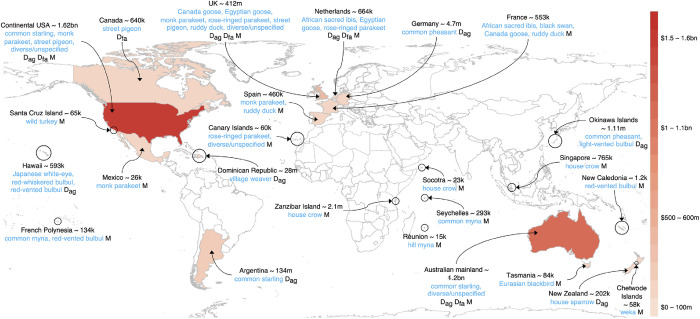
Fig 1. The spatial distribution of the observed economic costs associated with alien birds (US$, 2017 exchange rate).
k = thousand; m = million; bn = billion. Dag = costs associated with damage to agriculture; Dfa = costs associated with damage to facilities/infrastructure/buildings; M = cost associated with management. This map was made with Natural Earth. Free vector and raster map data @ naturalearthdata.com.

