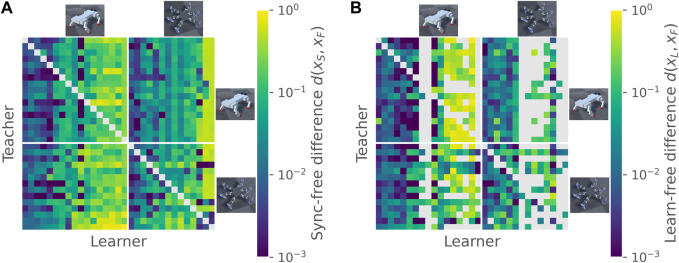
FIGURE 2.
Diversification of gait pattern. Panel (A) shows the difference between synchronized and free gaits for all pairs of teachers and learners, ordered by morphology. Lower values indicate a smaller difference. Within each morphology, individuals are ordered by their mean synchronization difference as a learner. Diagonals are left blank since individuals were not tested against themselves in teacher-learner pairs. Panel (B) shows the difference between feedback-learned and free gaits, ordered as in (A). Non-diagonal blank elements indicate that no cross-correlation peaks were found during the period learning stage, and hence the feedback stage was not run.

