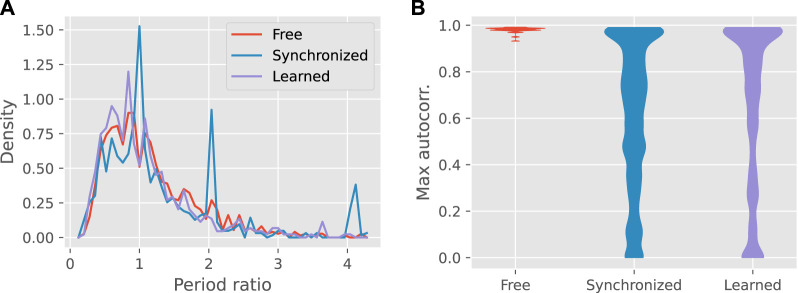
FIGURE 4.
Panel (A) shows the frequency distribution of the ratio of the output to input period over all teacher-learner pairs, for the three input conditions. (B) Violin plots of the overall maximum of the autocorrelation function, showing the distributions over all teacher-learner pairs. The distribution for learned gaits only includes pairs for which feedback was actually applied.

