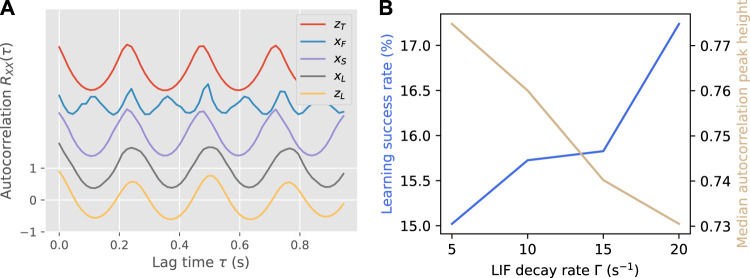
FIGURE 6.
Panel (A) shows an example of autocorrelation functions modified by synchronization and learning, for the same teacher-learner pair as in Figure 3. Each autocorrelation function is offset from the previous by 1 for visibility. For this pair, d(x S , x F ) = 0.279, d(x L , x F ) = 0.240, d(x S , z T ) = 0.002, d(x L , Z T ) = 0.145. Panel (B) shows the learning success rate and median autocorrelation peak height over all teacher-learner pairs as a function of the LIF decay rate Γ.

