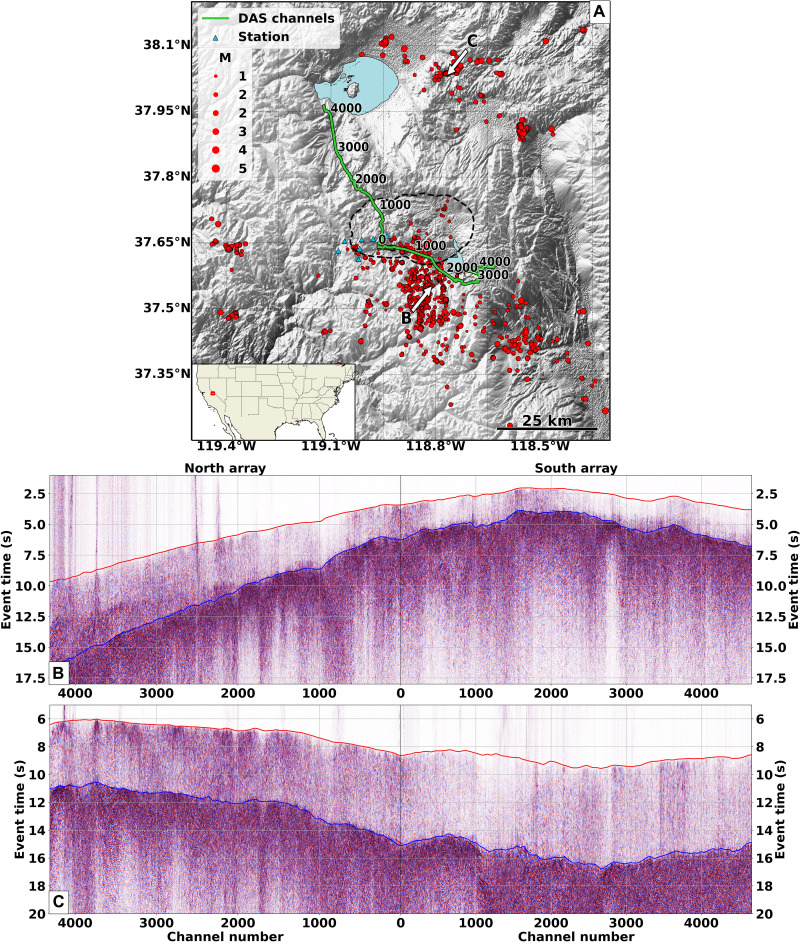
Fig. 1. Study area and local and regional events from DAS array.
(A) Map of the study area in which the distributed acoustic sensing (DAS) channels (green line), seismic stations (blue triangles), and earthquakes (red dots) are indicated. The black dashed line delineates the limit of the Long Valley Caldera. The white arrows point to the two events shown in the bottom panels. The red box in the map inset indicates the study area within the United States. (B and C) Strain recorded by the DAS arrays induced by local events with Northern California Earthquake Data Center (NCEDC) double-difference (DD) catalog IDs 73482516 and 73491170, respectively. The red and blue curves in these panels show the P- and S-wave neural network–picked travel times on these two events, respectively. M, Magnitude.

