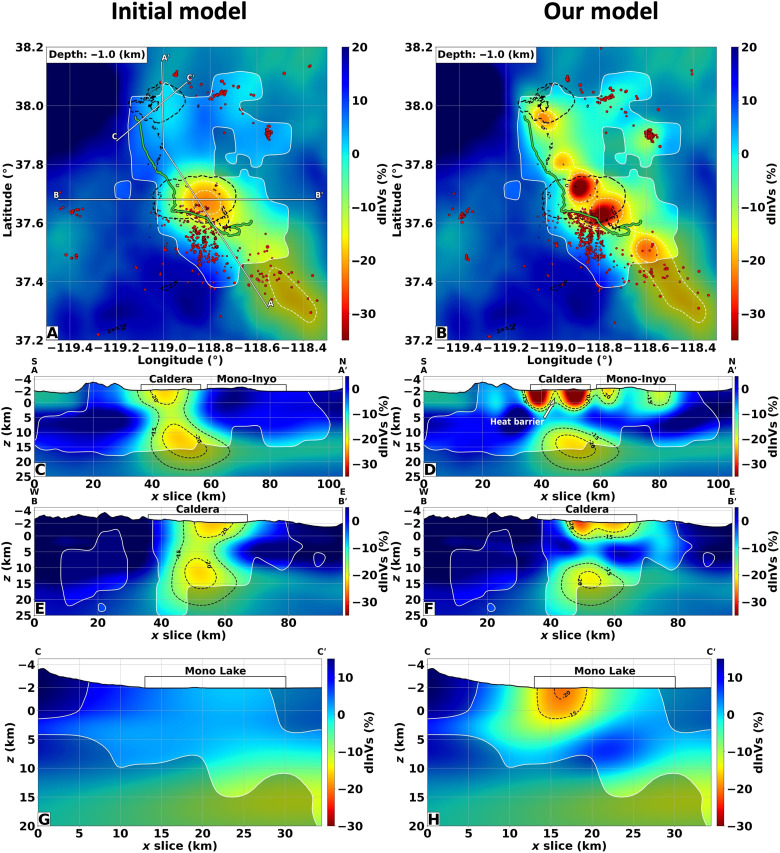
Fig. 2. The Long Valley shear-wave anomalies.
The panels on the left column display the initial model derived from surface-wave inversion, while the panels on the right depict the inverted S-wave velocity anomalies obtained by our tomographic DAS workflow. All perturbations are with respect to a one-dimensional Walker Lane crust profile (obtained by averaging the initial model along latitude and longitude). (A and B) Depth slices at −1.0 km elevation. The caldera and lakes’ extents are shown by the black dashed lines. (C to H) Model profiles indicated in (A). The white (A and B) and black (C to H) dashed lines delineate the −20 and −15% P-wave velocity contours. The white solid lines separating the shaded areas denote the resolvable model portions.

