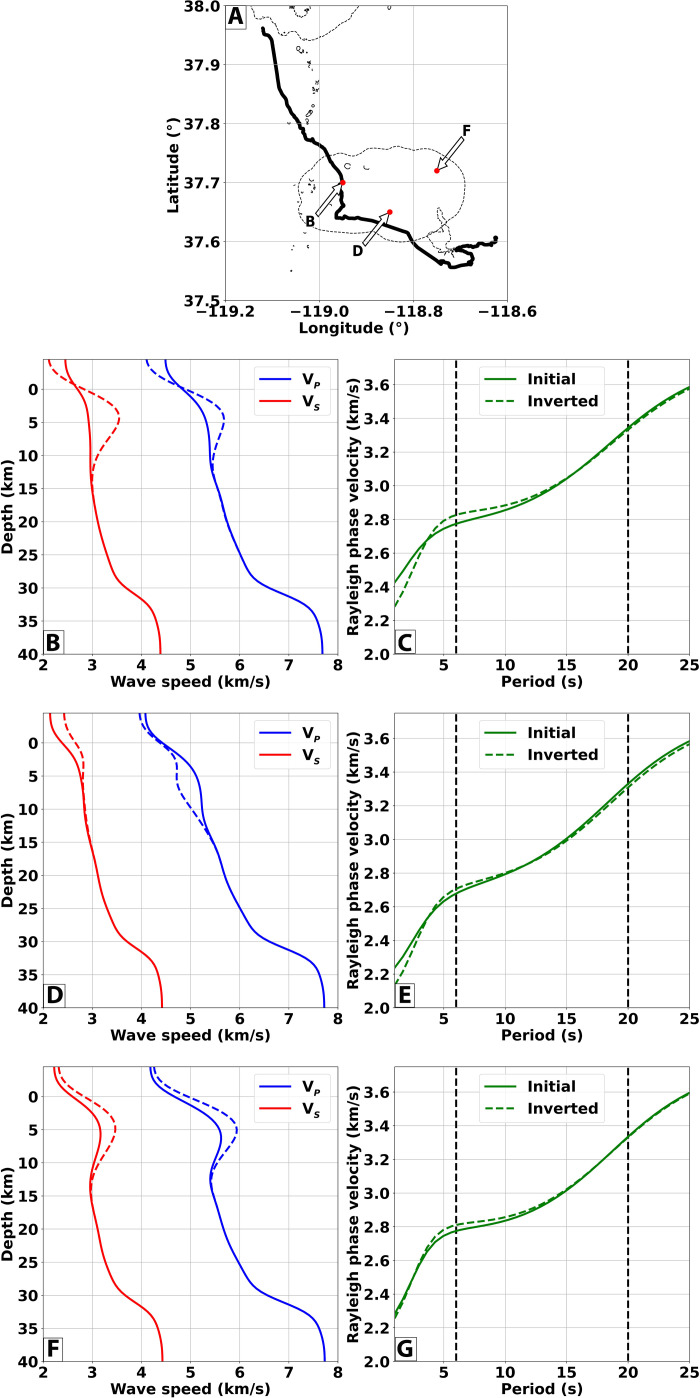
Fig. 4. Surface-wave dispersion curves from initial and inverted models.
(A) Map showing the locations for which the surface-wave dispersion curves are computed. (B, D, and F) VP (red lines) and VS profiles of the initial (solid lines) and inverted (dashed line) models extracted at the corresponding points in (A). (C, E, and G) Rayleigh dispersion curves for the corresponding panels on the left evaluated using the initial (solid green line) and inverted (dashed green lines) velocity profiles. The black vertical lines indicate the period range used to construct the initial velocity models [i.e., 6 to 20 s periods; (40)].

