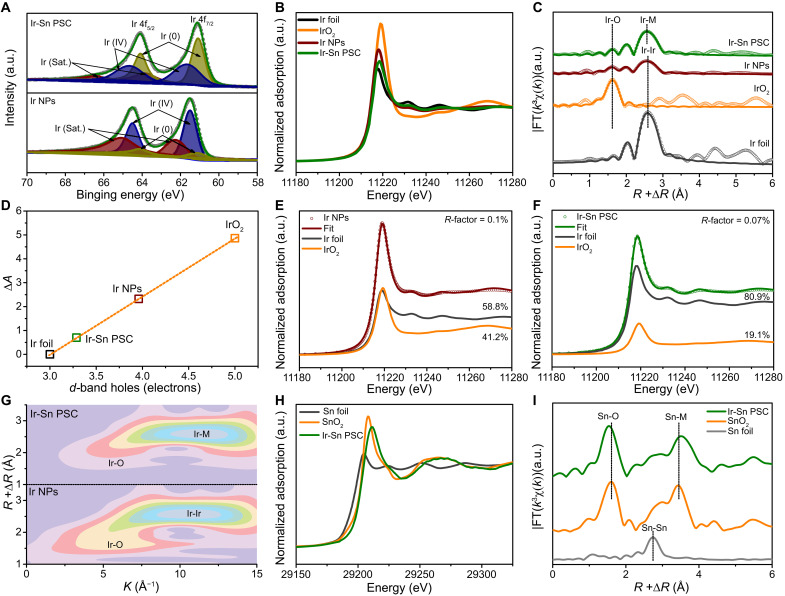
Fig. 2. Electronic structure of Ir-Sn PSC.
(A) High-resolution Ir 4f XPS spectra of Ir NPs and Ir-Sn PSC. (B) Ir L3-edge XANES spectra of Ir foil, IrO2, Ir NPs, and Ir-Sn PSC. (C) The Ir L3-edge EXAFS spectra (points) and curve fits (lines) for Ir foil, Ir NPs, IrO2, and Ir-Sn PSC. The data are k3-weighted and not phase-corrected. (D) White line peak area difference as a function of the formal d-band hole count. Ir L3-edge XANES spectra fitting results for (E) Ir NPs and (F) Ir-Sn PSC. (G) WT-EXAFS contour maps of the Ir L3-edge for Ir NPs and Ir-Sn PSC. (H) Sn K-edge XANES spectra of Sn foil, Ir-Sn PSC, and SnO2. (I) The corresponding Sn K-edge EXAFS spectra (points) and curve fits (lines). The data are k3-weighted and not phase-corrected. a.u., arbitrary units.

