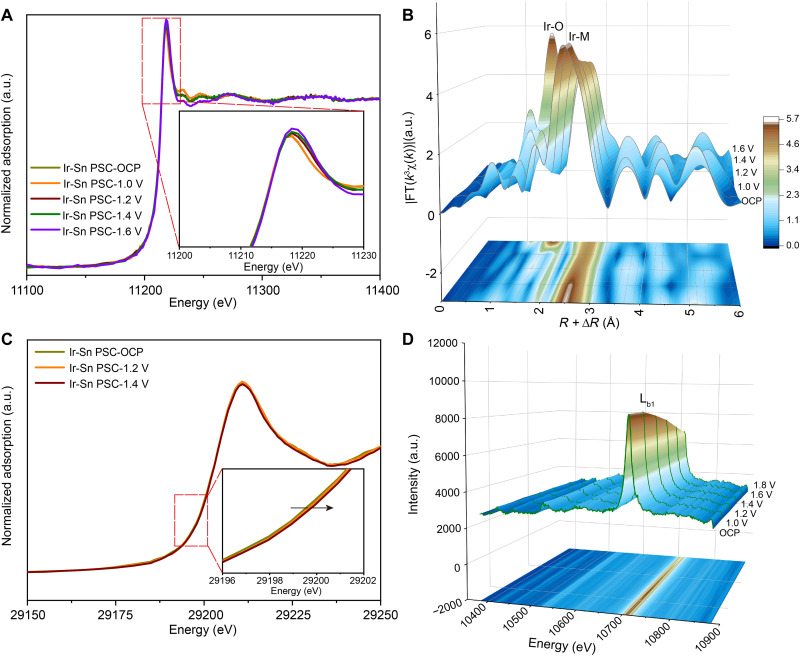
Fig. 5. Dynamic evolution of the electronic structure of Ir-Sn PSC during the OER process.
(A) Operando XANES spectra of the Ir L3-edge for Ir-Sn PSC at different voltages. The inset is the magnified image in the red rectangle area shown in (A). (B) The corresponding Ir L3-edge EXAFS spectra, shown in R space. The data are k3-weighted and not phase-corrected. (C) Operando Sn K-edge XANES spectra. Inset is an enlargement figure of the indicated range in (C). (D) Operando Ir Lb1 XES spectra recorded on Ir-Sn PSC from open circuit potential to 1.8 V versus RHE.

