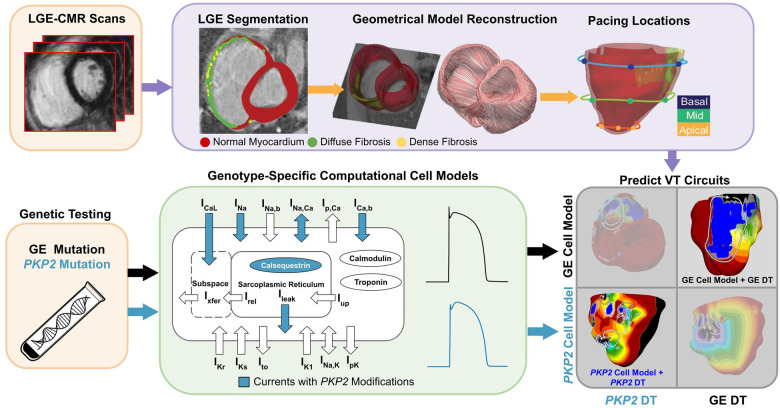
Figure 1. Overview of the study.
The flowchart summarizes the workflow of using Geno-DT to understand ARVC arrhythmogenesis and to predict VTs in ARVC patients of the two genotype groups, PKP2 and GE. Geno-DT integrates genotype-specific cell models (green) and patient-specific clinical-image-based heart digital twin modeling. Orange blocks refer to clinical data, which include genetic testing results and LGE-MRI images for each patient in the cohort. Patient-specific geometrical heart models were reconstructed from the LGE-CMR (top, purple, left and middle images). Genotype-specific cell models (green) developed here were incorporated into each heart model based on the patient’s genetic testing result. The integrated multi-scale (from the subcellular to the organ), patient-specific Geno-DT models were subjected to rapid pacing from multiple sites on the RV (top purple, rightmost image) to understand the role of remodeling in ARVC arrhythmogenesis and to predict VT circuits (bottom gray).

