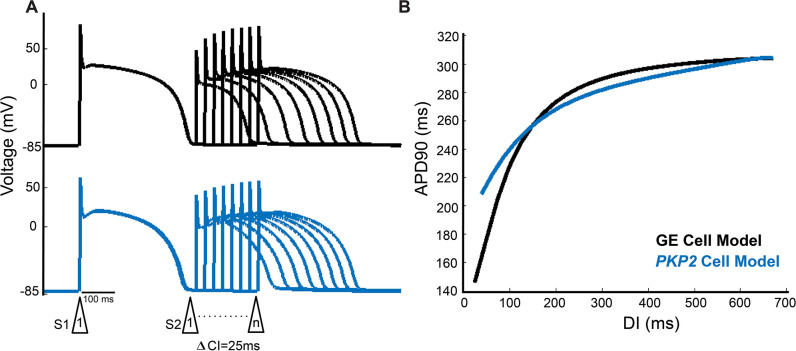
Figure 3. The PKP2 cell model exhibits poorer rate adaptation and a flatter electrical restitution curve as compared to the GE model.
(A) Representative premature APs at DIs decrementing to just before loss of one-to-one capture of GE cell model (top) and PKP2 cell model (bottom). (B) APD restitution curves of GE and PKP2 cell models.

