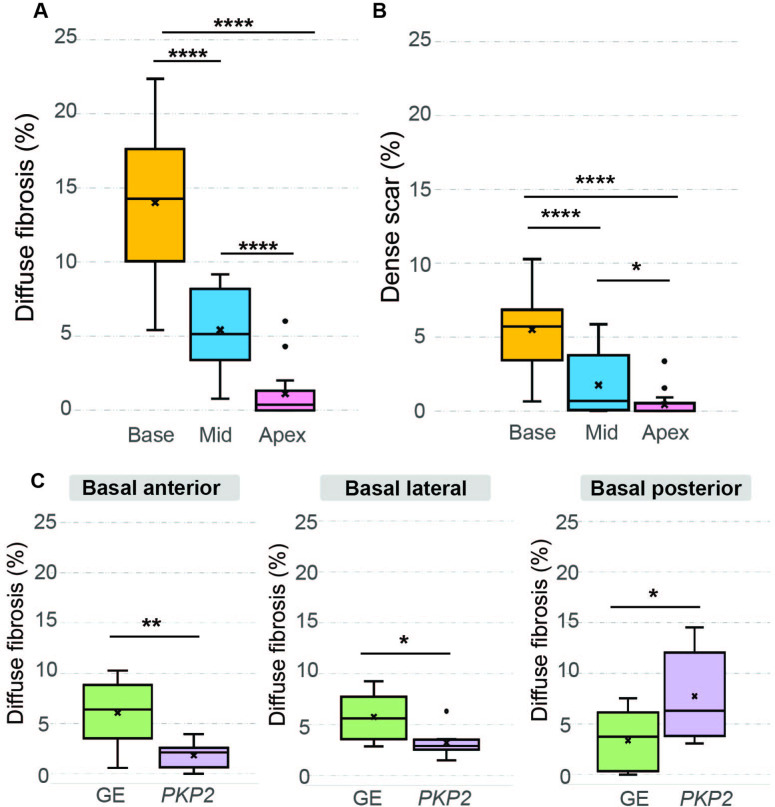
Figure 4. Amounts of diffuse fibrosis and dense scar in different regions of the RV and in the two patient groups.
(A, B) Boxplots showing the amount of diffuse fibrosis (A, Base: n = 16, interquartile range [IQR] = 7.43; Mid: n = 16, IQR = 4.65; Apex: n = 16, IQR = 1.18; ****p < 0.0001) and dense scar (B, Base: n = 16, IQR = 2.73; Mid: n = 16, IQR = 3.14; Apex: n = 16, IQR = 0.36; *p < 0.05, ****p < 0.0001) in the entire ARVC cohort in different regions of the RV. (C) Boxplots comparing diffuse fibrosis amounts in different RV AHA segments between the two genotype groups. Significance was found in the following basal segments: basal anterior (GE: n = 8, IQR = 2.91; PKP2: n = 8, IQR = 1.78; **p < 0.01), basal lateral (GE: n = 8, IQR = 3.21; PKP2: n = 8, IQR = 0.75; *p < 0.05), and basal posterior (GE: n = 8, IQR = 4.74; PKP2: n = 8, IQR = 7.25; *p < 0.05). Amounts of diffuse fibrosis/dense scar are normalized with respect to the patient’s total RV tissue volume. Median and interquartile range were represented in each boxplot, where dots indicate outliers. Paired Student’s t-tests were applied to assess statistical significance.

