Figure 3.

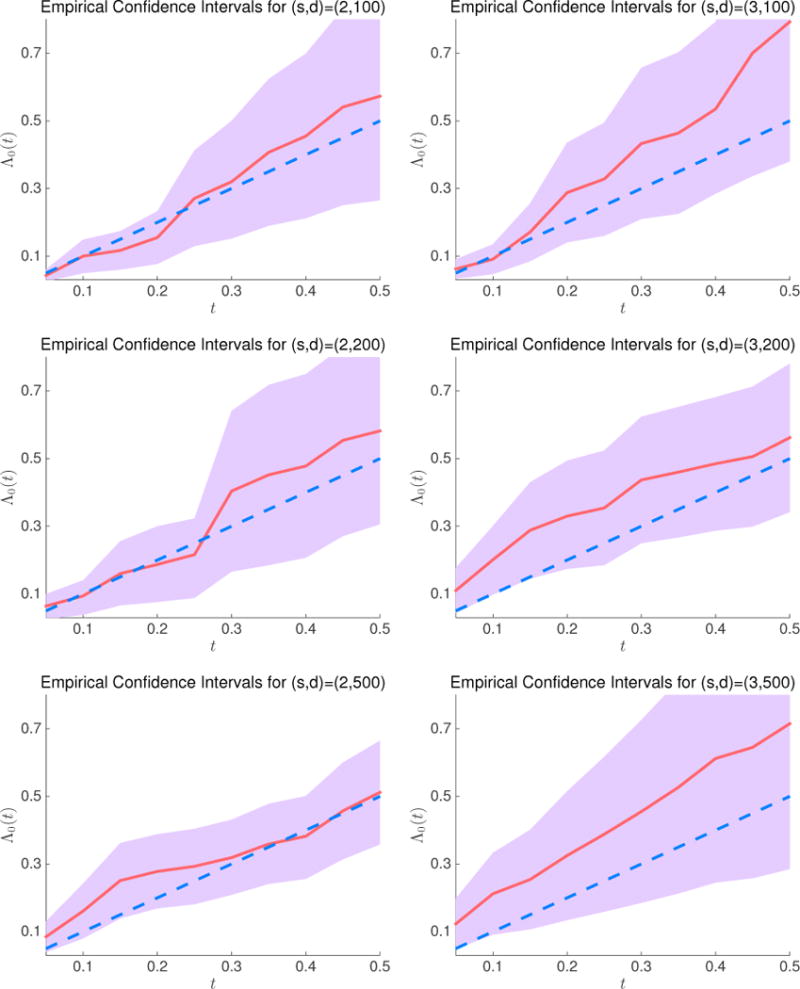
95% confidence intervals for the baseline hazard function at t = 0.05, 0.1, …, 0.5. The red solid line denotes the estimated baseline hazard function , and blue dashed line denotes Λ0(t) = t.

95% confidence intervals for the baseline hazard function at t = 0.05, 0.1, …, 0.5. The red solid line denotes the estimated baseline hazard function , and blue dashed line denotes Λ0(t) = t.