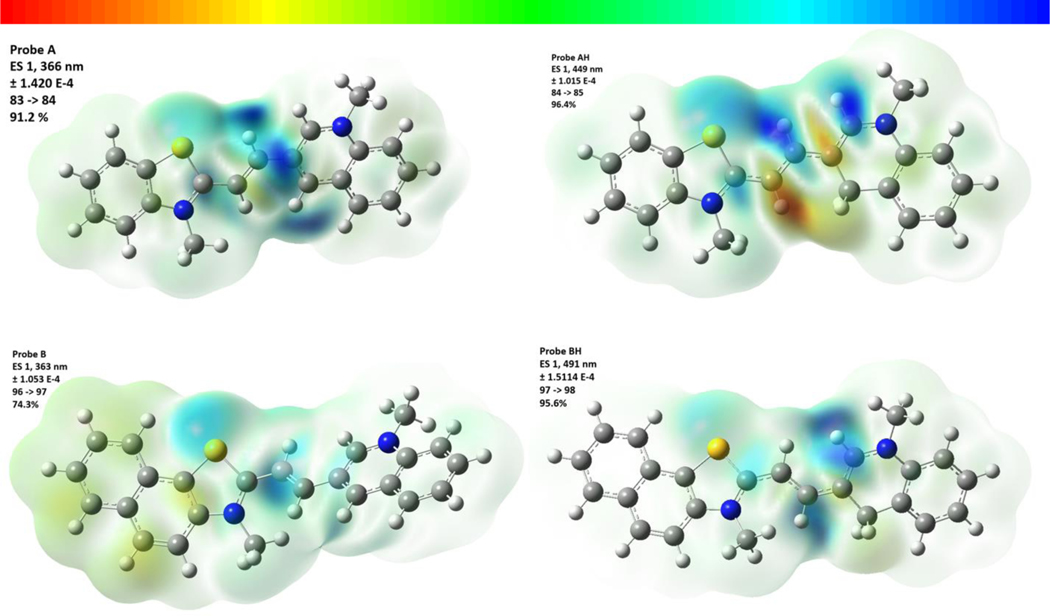
Figure 5.
3D surface illustrations of probes A, AH, B, and BH depicting the electron density variance for their primary electron transitions. The top of the figure displays the color scale values. Please refer to the Supplementary Material for diagrams illustrating the molecular orbitals associated with these transitions.

