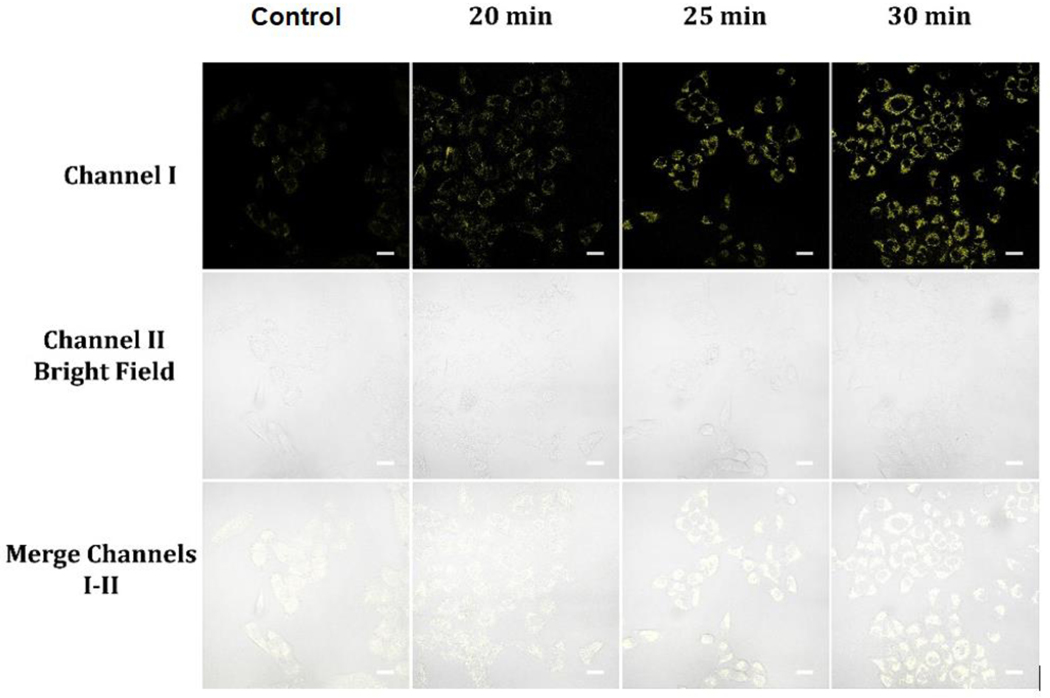
Figure 6.
Cellular luminescence images of A549 cells preloaded with 20 μM NADH in glucose-free DMEM medium for 30 minutes and cultivated with 10 μM probe A in glucose-free DMEM medium for varying incubation times, as well as a control image of A549 cells cultivated with 10 μM probe A in glucose-free DMEM medium for 30 minutes. Image fluorescence signals were captured between 550 to 650 nm upon 488 nm excitation for both sets of images.

