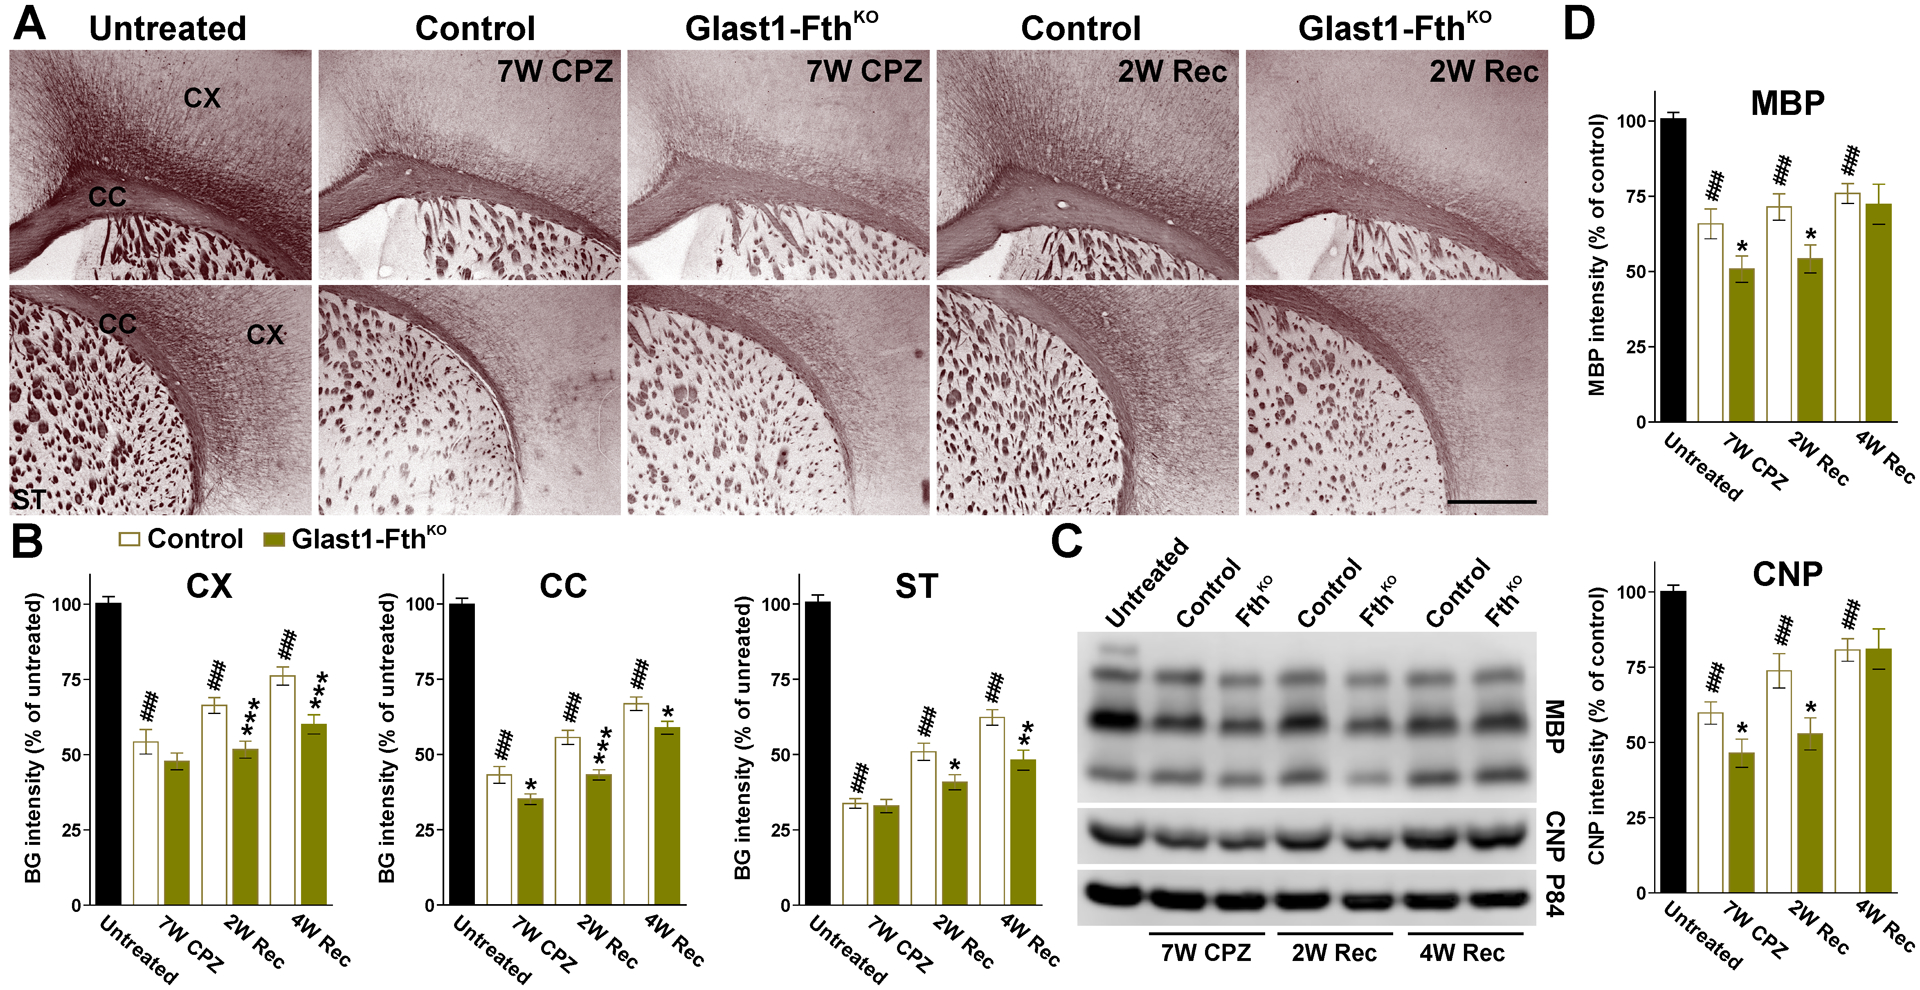
FIGURE 11: Black-gold staining in the remyelinating Glast1-FthKO brain.

(A) Black-gold staining in untreated, control and Glast1-FthKO mice at the end of the CPZ treatment (7W CPZ) and after 2 and 4 weeks of recovery (2W and 4W Rec). Scale bar=180μm. (B) Black-gold staining intensity in the CX, CC and ST of untreated, control and Glast1-FthKO mice at the end of the CPZ treatment (7W CPZ) and after 2 and 4 weeks of recovery (2W and 4W Rec). (C and D) Western blots for MBP and CNP in brain tissue comprised of the CX and CC. p84 was used as the internal standard and data from 4 independent experiments are summarized based on the relative spot intensities and plotted as percent of untreated mice. Values are expressed as mean ± SEM. ### p<0.001 versus untreated; * p<0.05, **p<0.01, ***p<0.001 versus control.
