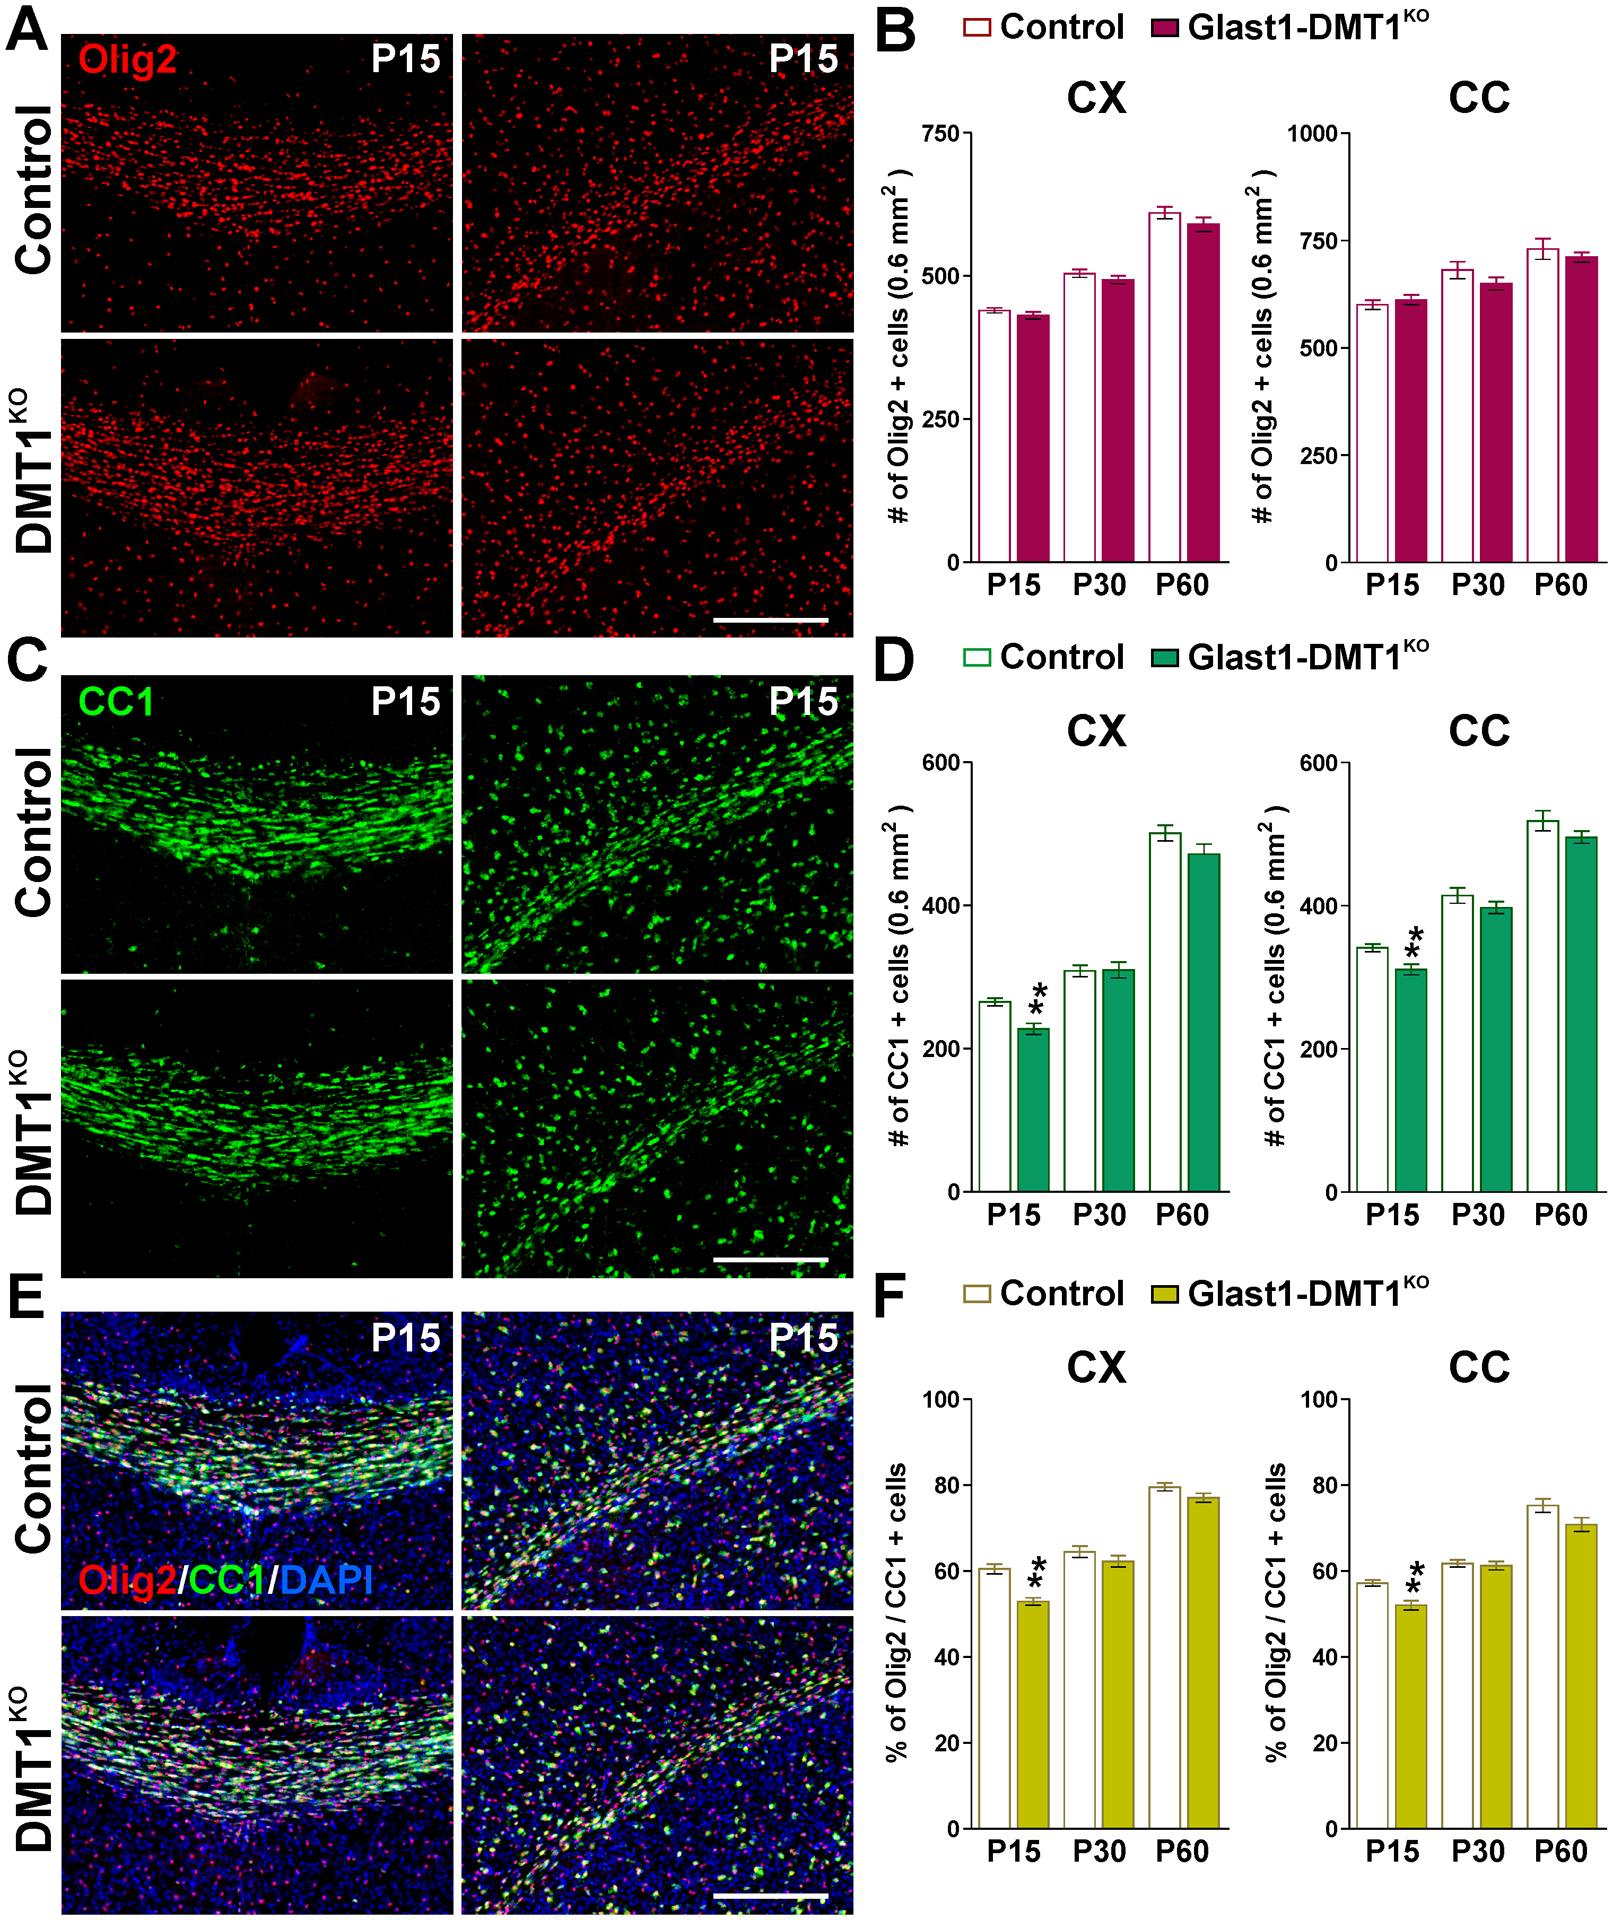
FIGURE 4: Oligodendrocyte numbers in Glast1-DMT1KO brain during early development.

(A, C and E) Brain coronal sections from control and Glast1-DMT1KO mice immunostained for Olig2 and CC1 at P15. Scale bar=90μm. (B, D and F) Total number of Olig2 and CC1-positive cells and percentage of Olig2/CC1 double-positive cells in the CX and CC at P15, P30 and P60. Values are expressed as mean ± SEM. *p<0.05, **p<0.01, ***p<0.001 vs. respective controls.
