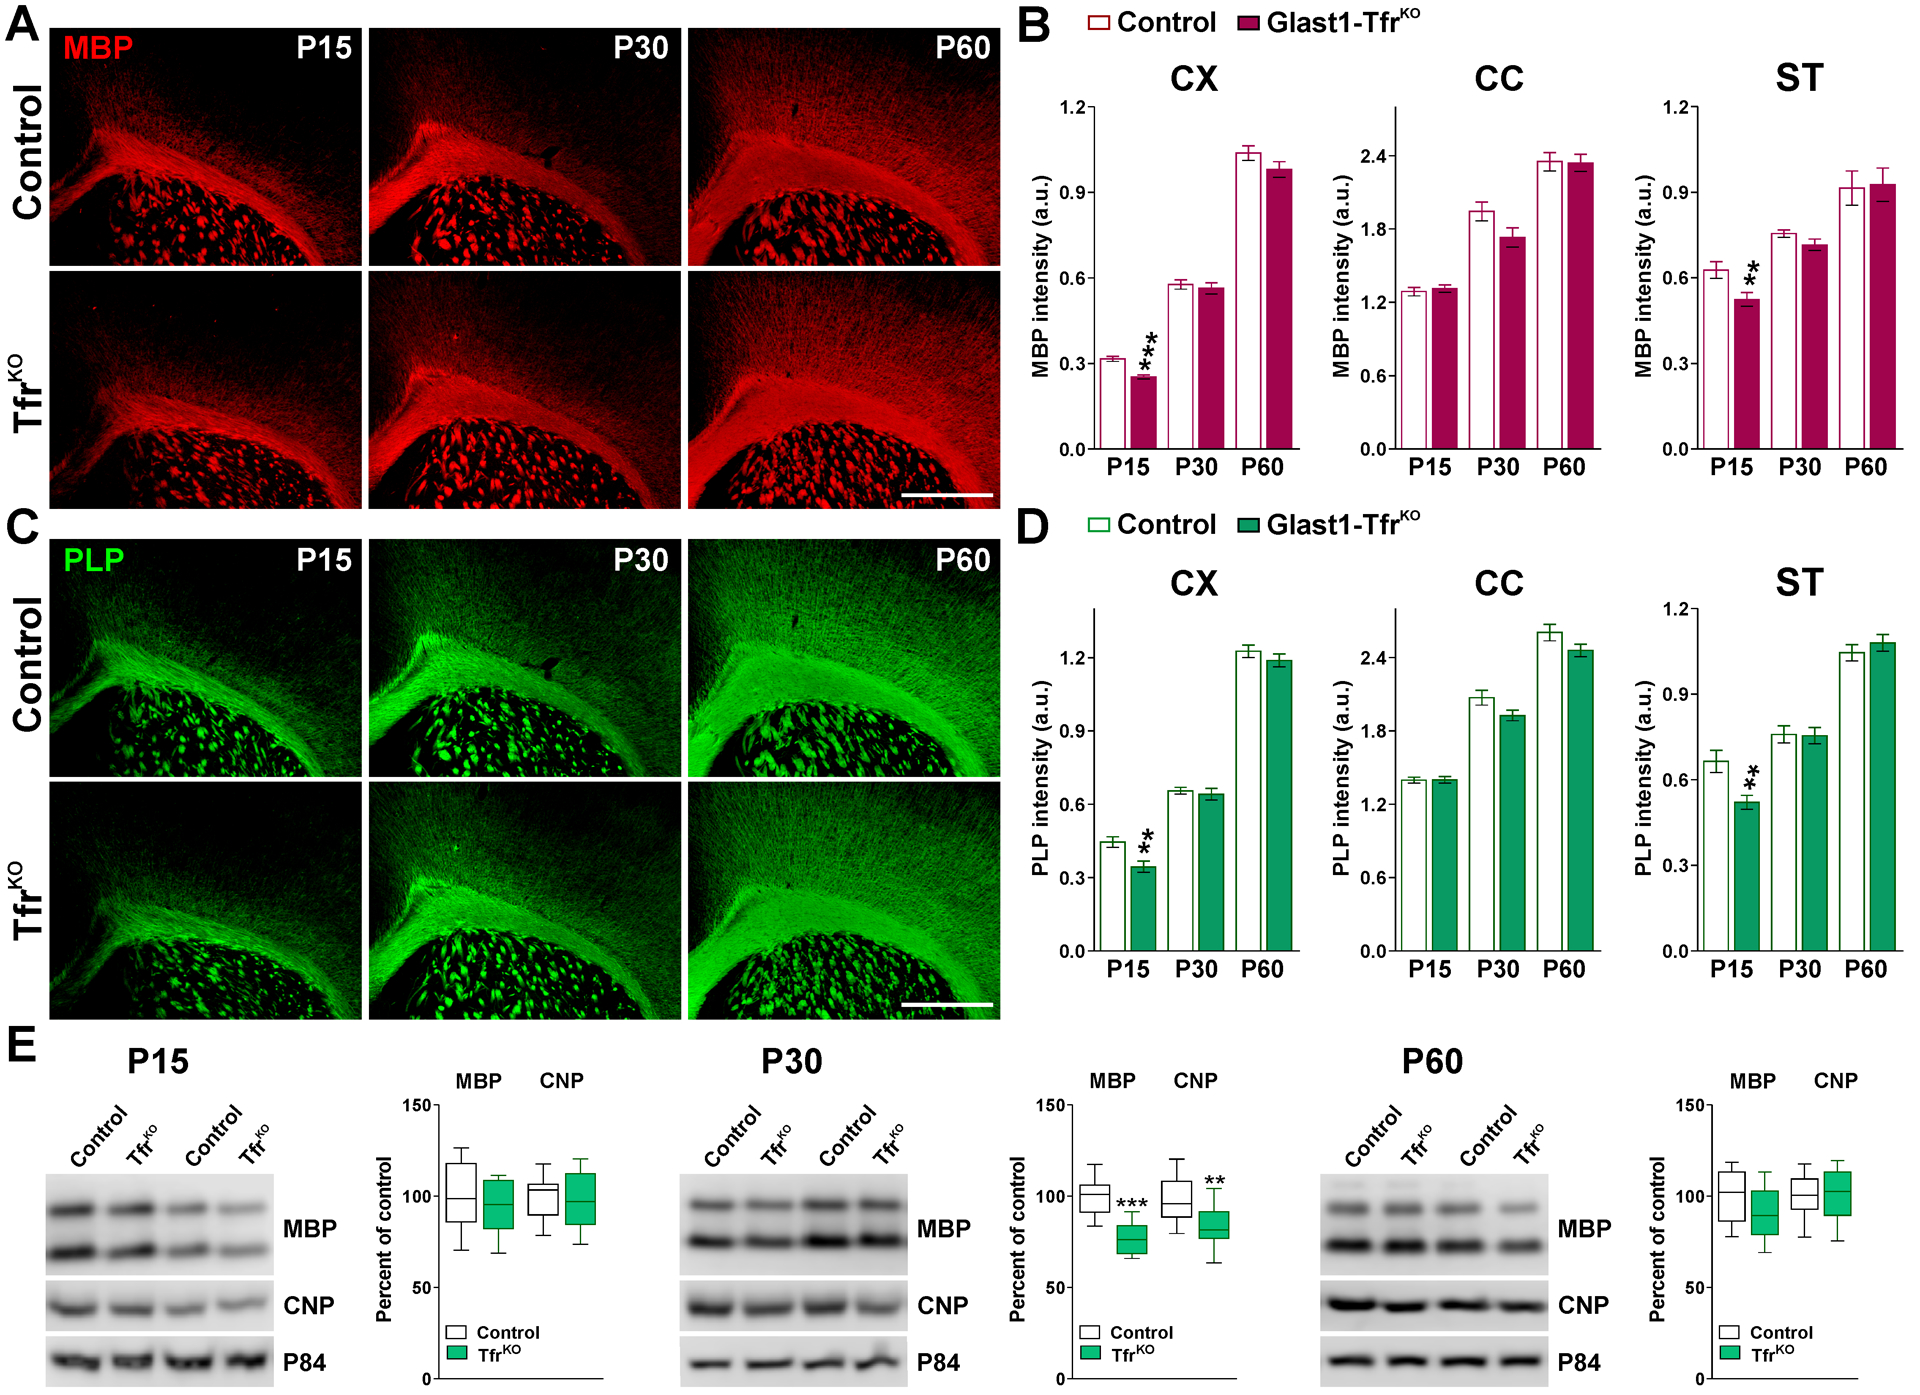
FIGURE 5: Myelin protein levels in the brain of Glast1-TfrKO animals.

(A and C) MBP and PLP immunostaining in the brain of control and Glast1-TfrKO mice at P15, P30 and P60. Scale bar=180μm. (B and D) Integrated fluorescence intensity for MBP and PLP in the CX, CC and ST. Values are expressed as mean ± SEM. **p<0.01, ***p<0.001 vs. respective controls. (E) Representative western blots for MBP and CNP in the CC of control and Glast1-TfrKO animals at P15, P30 and P60. P84 was used as the internal standard and box-and-whisker plots are showing means ± SD from 4 independent experiments. *p<0.05, **p<0.01, ***p<0.001 vs. respective controls.
