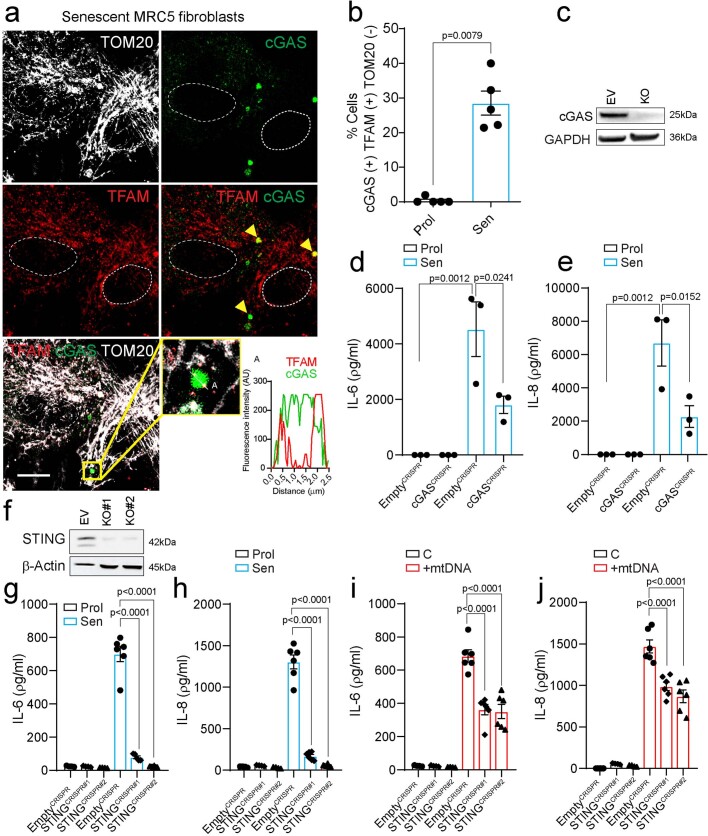
Extended Data Fig. 7. Cytosolic mtDNA acts via the cGAS–STING pathway to drive the SASP in senescent cells.
(a) Representative immunofluorescence image of cGAS–GFP fusion protein (green) co-localizing with TFAM (red) in senescent cells. Magnification at the bottom shows cGAS–GFP reporter colocalizing with TFAM foci in the absence of TOM20 (white) (scale bar is 20 µm). Graph represents quantification of cGAS and TFAM signals in selected linear region indicated in a. (b) Quantification of the percentage of proliferating and senescent cells (IR) containing cGAS co-localizing with cytosolic TFAM foci (n = 5 independent experiments). (c) Western blot showing the level of cGAS upon CRISPR/Cas9-mediated cGAS deletion. Representative blot of n = 1 independent experiment. Secreted levels of (d) IL-6 and (e) IL-8 in proliferating and senescent EV and cGAS-deficient MRC5 human fibroblasts (n = 3 independent experiments). (f) Representative Western blot showing the level of STING upon CRISPR/Cas9-mediated STING deletion using two different gRNAs. Blot is representative of n = 2 independent experiments. Secreted levels of (g) IL-6 and (h) IL-8 in proliferating (n = 4 independent experiments) and senescent (n = 6 independent experiments) EV and STING-deficient MRC5 human fibroblasts. Secreted levels of (i) IL-6 and (j) IL-8 in EV and STING-deficient MRC5 human fibroblasts upon mtDNA transfection (n = 4 for control, n = 6 independent experiments for +mtDNA condition). Data are mean ± S.E.M. Statistical significance was assessed using two-sided Student’s unpaired t-test (b), one-way ANOVA followed by Tukey’s multiple comparison test (d, e, g-j).

