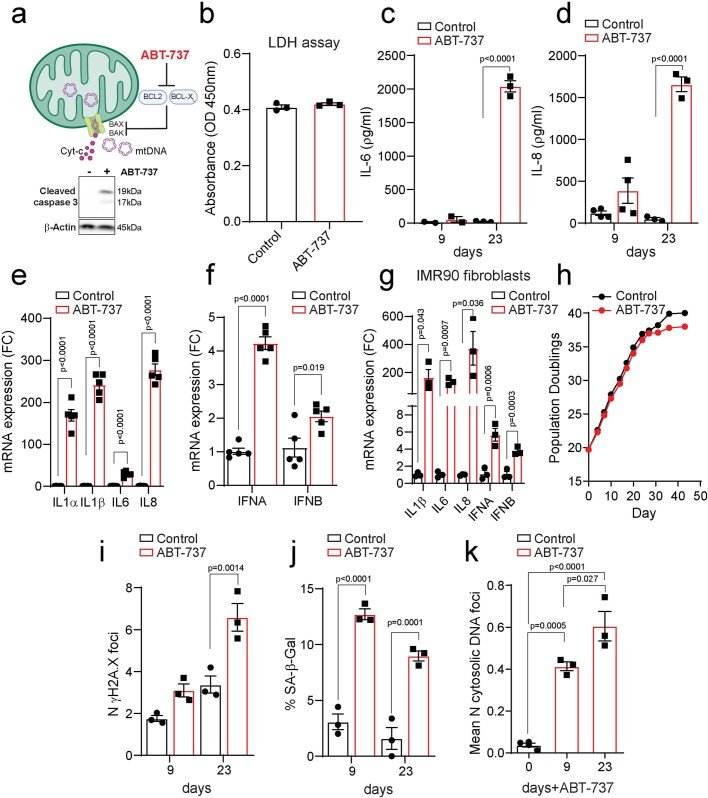
Extended Data Fig. 1. ABT-737 treatment induces miMOMP and drives a SASP-like response.
(a) Scheme representing the mechanism by which ABT-737 induces miMOMP. Below, representative Western blot showing cleaved caspase 3 in proliferating and ABT-737- treated MRC5 fibroblasts. (b) Absorbance values (at 450 nm) as a measure for lactate dehydrogenase (LDH) release from proliferating MRC5 fibroblasts treated with vehicle or ABT-737 for 72 h (n = 3 independent experiments), showing no difference in cell death. Levels of secreted (c) IL-6 (n = 2 and n = 3 independent experiments, 9 and 23 days, respectively) and (d) IL-8 in control and MRC5 fibroblasts treated with ABT-737 for 9 (n = 4 independent experiments) and 23 days (n = 3 independent experiments). Quantification of mRNA expression levels of interleukins (IL-1α,β, IL 6 and IL-8), interferon genes (IFN-α and β) in MRC5 (n = 5 independent experiments) (e-f) and IMR90 fibroblasts (n = 3 independent experiments) (g) 23 days after ABT-737 treatment. (h) Graph showing population doublings of control and ABT-737-treated MRC5 fibroblasts. Quantification of (i) mean number of γH2AX foci, (j) percentage of Sen-β-Gal-positive cells and (k) mean number of DNA nucleoids located outside of the mitochondrial network in control and MRC5 fibroblasts treated with ABT-737 for 9 and 23 days (n = 3 independent experiments; n = 4 for day 0). Data are mean ± S.E.M. Statistical significance was assessed using one-way ANOVA followed by Tukey’s multiple comparison test (k), two-sided Student’s unpaired t-test (b, e-g), two-way ANOVA followed by Sidak’s multiple comparison test (c, d, i, j).

