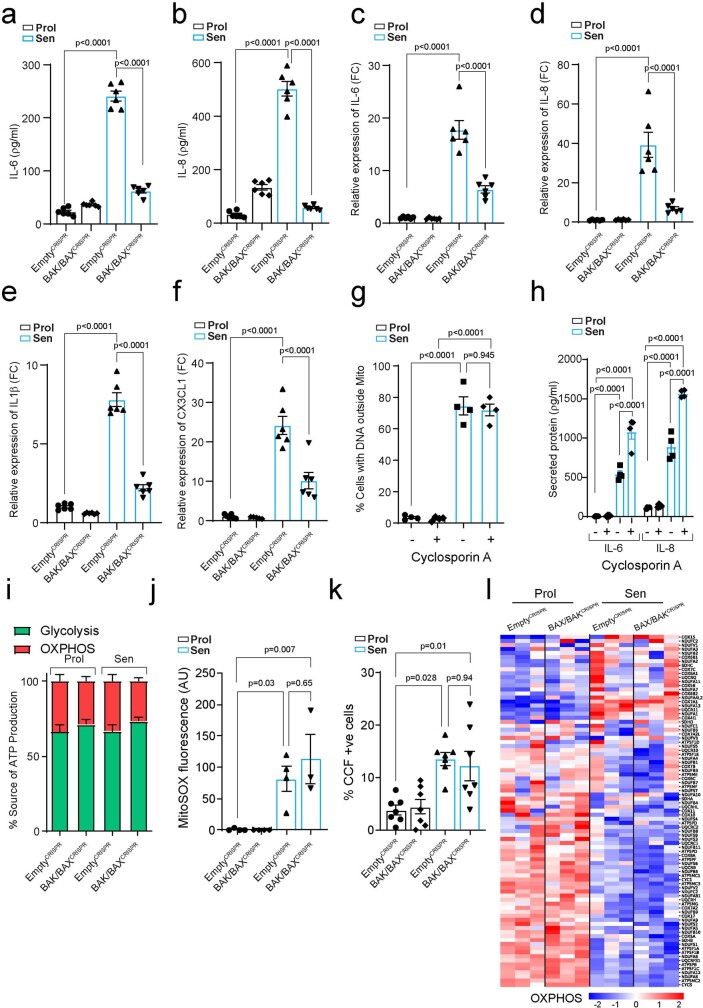
Extended Data Fig. 2. BAX and BAK mitochondrial pores regulate the SASP without the involvement of the MPTP.
Levels of secreted (a) IL-6 and (b) IL-8 in proliferating and senescent (IR) EV and BAX/BAK-/- cells (n = 6 independent experiments). Quantification of mRNA levels of (c) IL-6, (d) IL-8, (e) IL1β and (f) CX3CL1. Data are expressed as fold change to proliferating EV cells (n = 6 independent experiments). (g) Percentage of cells containing DNA foci located outside of mitochondrial network, and (h) Levels of secreted IL-6 and IL-8 in proliferating and senescent cells treated with DMSO or 1 μM Cyclosporin A (n = 4 independent experiments). (i) Graph showing the energy production by glycolysis or oxidative phosphorylation normalized to total ATP production and expressed as a percentage (n = 5 independent experiments; n = 4 Sen BAK/BAXCRISPR). (j) Quantification of MitoSOX fluorescence intensity in proliferating and senescent EV and BAX/BAK−/− cells (n = 4 independent experiments for Prol and Sen EV and Prol BAX/BAK−/− cells; n = 3 independent experiment for Sen BAX/BAK−/− cells). (k) Quantification of the percentage of EV and BAX/BAK−/− cells displaying Cytoplasmic chromatin Fragments (CCF) (n = 7 independent experiments). (l) Column clustered heatmap of OXPHOS genes that are differentially expressed in senescent cells and are not changed by BAX/BAK deletion. The colour intensity represents column Z-score, where red and blue indicate high and low expression, respectively. Data are mean ± S.E.M. Statistical significance was assessed using one-way ANOVA followed by Tukey’s multiple comparison test (a-k).

