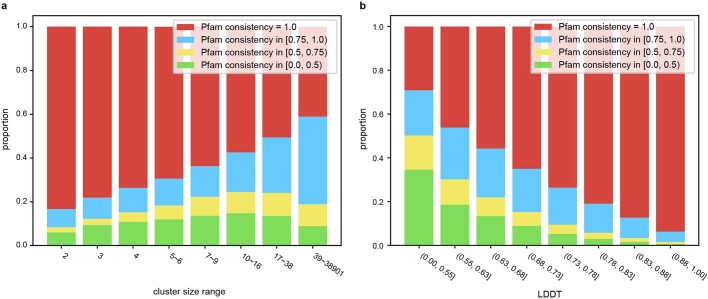
Extended Data Fig. 2. Relationship of mean pairwise Pfam consistency to cluster features. These graphs are plotted with 1,004,422 clusters with at least two Pfam annotated sequences.
(a) We analysed Pfam consistency of clusters binned by their member counter. These bins represent Pfam annotated non-singleton clusters at rates of 19.2%, 13.5%, 9.5%, 12.6%, 11.0%, 12.4%, 11.8% and 10.0% from left to right, respectively. (b) We analysed Pfam consistency of clusters binned by their LDDT of each cluster. These bins represent Pfam annotated non-singleton clusters equally.

