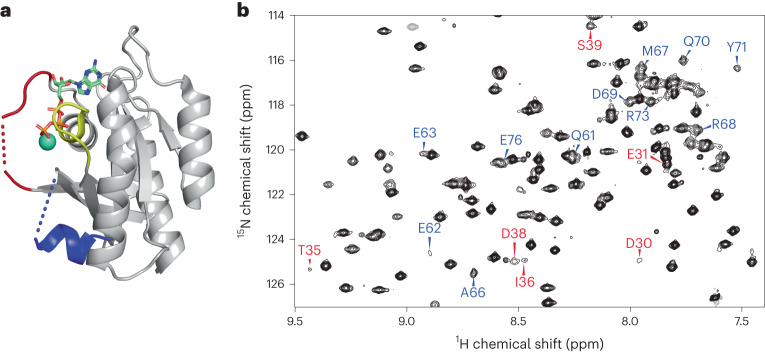
Fig. 1. Depiction of the X-ray crystal structure of the GTP form of WT K-Ras and a representative solution NMR amide spectrum.
a, X-ray crystal structure of WT K-Ras·GTP (PDB 5VQ2), where large sections of Switch I (red) and Switch II (blue) are missing. b, A section of the reference spectrum from the 15N CPMG relaxation dispersion data of WT K-Ras·GTP, highlighting some of the assignments of residues from Switch I (red) and Switch II (blue), many of which have previously been unobservable.

