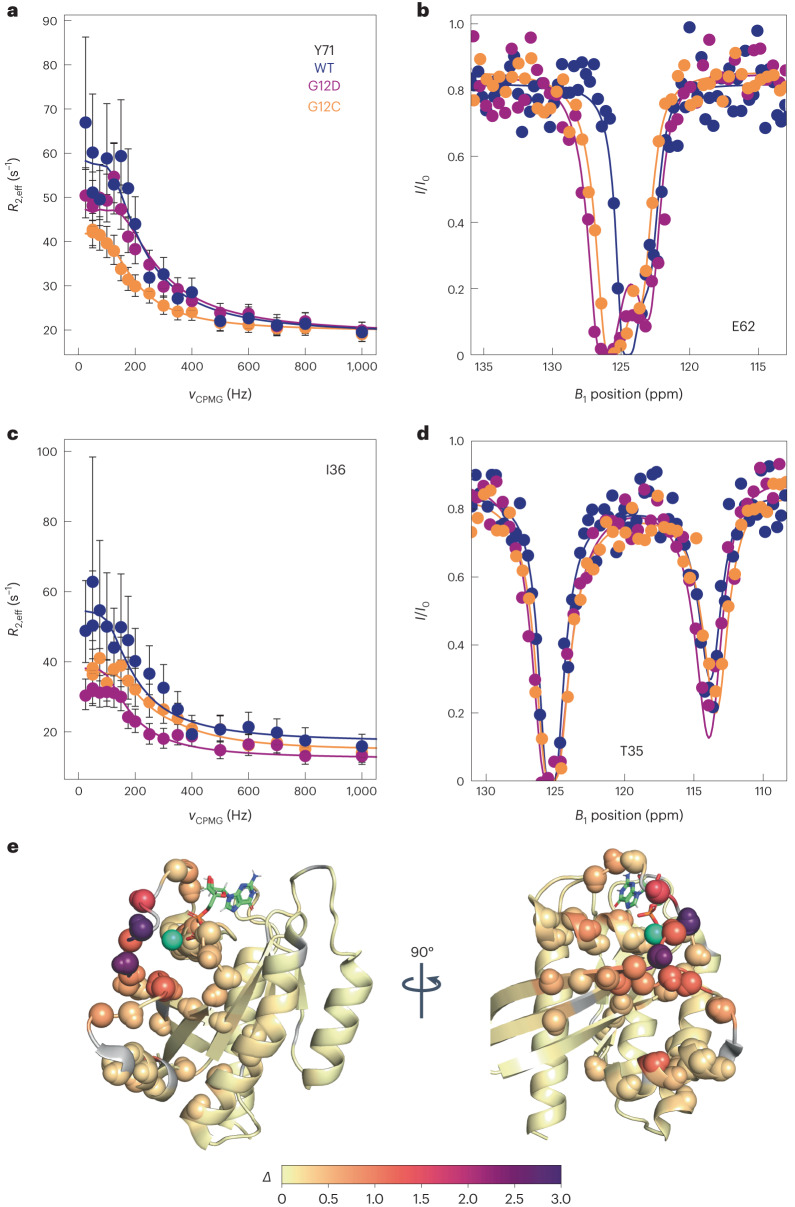
Fig. 2. Selected 15N-NMR relaxation dispersion curves and 15N CEST profiles for K-Ras·GTP with results color-coded on 3D structure of K-Ras.
15N-dispersion and CEST profiles are shown for WT (dark blue), G12D (purple) and G12C (orange) K-Ras bound to GTP. a, Selected Switch II 15N CPMG dispersion. Values of R2,eff were calculated as described in the Supplementary Information with errors derived from error propagation of the experimental uncertainties in signal amplitudes. Data are presented as the measured value plus or minus one standard deviation. b, Selected Switch II 15N CEST profiles. c, Selected Switch I 15N CPMG dispersions, presented as described in a. d, Selected Switch I 15N CEST profiles. e, Combined excited-state chemical shift differences Δ for WT K-Ras·GTP plotted on the K-Ras·GDP crystal structure (PDB 4OBE) for all residues, where , and σN and σHN are the standard deviations of amide 15N and 1HN chemical shifts with values 5.218 ppm and 0.634 ppm, respectively. Residues with Δ > 0.2 are shown as spheres, whereas unobserved residues are shown in gray. The teal sphere is the Mg2+ ion observed in the crystal structure.

