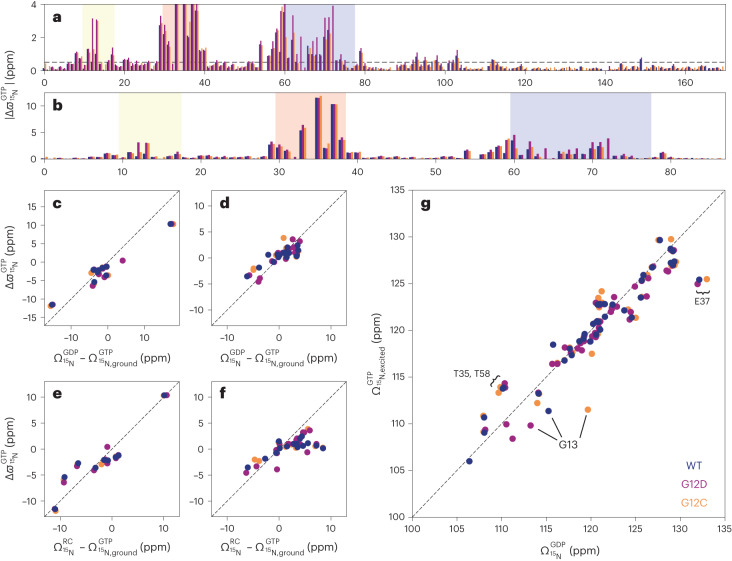
Fig. 3. Relating 15N NMR chemical shifts of excited state of K-Ras·GTP to alternative states of K-Ras.
In all panels, data for K-Ras·GTP for WT, G12D and G12C are colored dark blue, purple and orange, respectively. a, Unsigned 15N dynamic chemical shift differences |Δϖ| between excited and ground states, obtained from CPMG and CEST experiments (Methods), plotted against the primary sequence. The dashed line is at 0.5 ppm, and the P-loop, Switch I and Switch II regions are highlighted in yellow, red and blue, respectively. b, The same results are shown as in a, but showing the effector lobe residues only. c,d, Signed 15N Δϖ values for Switch I (c) and Switch II (d) residues correlated with the equilibrium chemical shifts (Ω) and their differences observed between the 15N–1H HSQC spectra of K-Ras·GDP and K-Ras·GTP, respectively. e,f, The corresponding correlations of Switch I (e) and Switch II (f) 15N Δϖ values with the differences between chemical shifts Ω predicted for random coil states and those observed for K-Ras·GTP. g, Depiction of the correlations between chemical shifts of the excited states of K-Ras·GTP and K-Ras·GDP for residues 1–86 with 15N |Δϖ| > 0.5 ppm. Dashed lines in c–g correspond to the diagonal with slope 1. The root-mean-square deviation and Pearson R2 correlation coefficients are provided in Table 2. Errors in the measurements are smaller than the symbol sizes.

