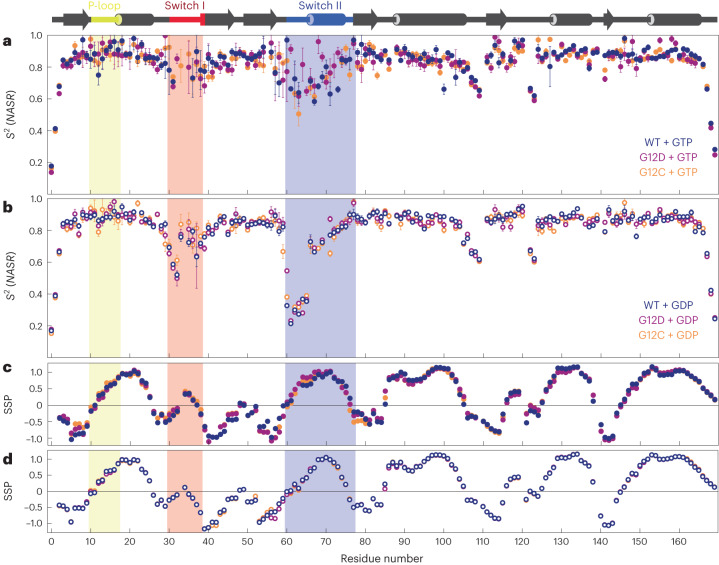
Fig. 4. Backbone dynamics of K-Ras·GTP (filled circles) and K-Ras·GDP (open circles) for WT (dark blue) and G12D (purple) and G12C (orange) mutants on the picosecond-to-microsecond timescale and SSP.
Secondary structural elements are shown at the top of the figure, with the P-loop, Switch I and Switch II regions shaded light yellow, red and blue, respectively. a,b, Backbone N–H S2 order parameters were determined by the NASR approach for K-Ras·GTP (a) and K-Ras·GDP (b). Data are presented as best-fit values plus or minus one standard deviation. Errors for the data points were determined through Monte Carlo simulation and standard error propagation. c,d, SSP of each variant derived from K-Ras·GTP (c) and K-Ras·GDP (d) 13Cα and 13Cβ chemical shifts.

