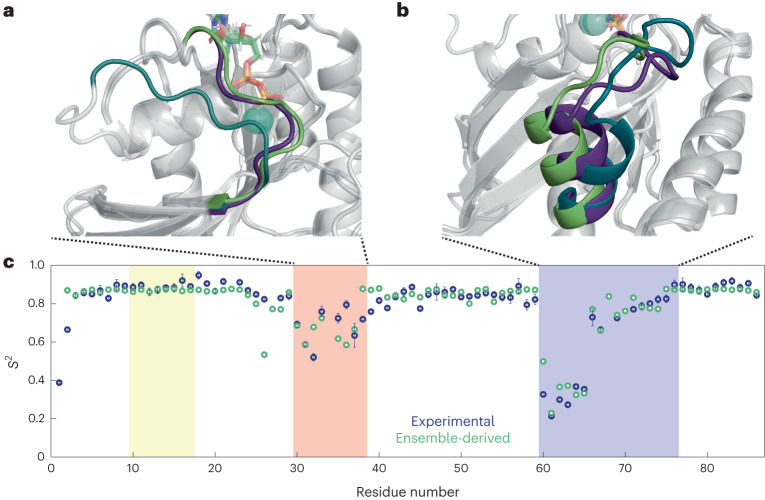
Fig. 6. X-ray-structure-derived minimal ensemble of K-Ras·GDP Switch I and Switch II conformations and back-calculated N–H S2 order parameters.
a,b, Backbone ribbon plots of K-Ras·GDP crystal structures highlighting Switch I (a) and Switch II (b). The ensemble consists of the WT K-Ras·GDP crystal structure (PDB 6MBU), the G12D mutant structure (PDB 4EPR, with engineered mutation C118S) and the A59G mutant structure (PDB 6ASE). The GDP nucleotide is shown in stick representation, and Mg2+ ions are shown as teal spheres. The Switch regions are indicated with nongray colors (6MBU: green, 4EPR: dark purple, 6ASE: dark cyan). c, Comparison between the ensemble-derived backbone N–H S2 order parameters (green) and the experimental S2(NASR) of WT K-Ras·GDP (dark blue). The S2(NASR) data are presented as the best fit plus or minus one standard deviation, as described in the caption of Fig. 4. Populations of 47% (6MBU), 39% (4EPR) and 14% (6ASE) best reproduce the experimental S2(NASR) results. The P-loop, Switch I and Switch II regions are highlighted in yellow, red and blue, respectively. The root-mean-square deviations between the ensemble-derived and experimental S2 values were 0.12 for the Switch I region and 0.06 for the Switch II region.

