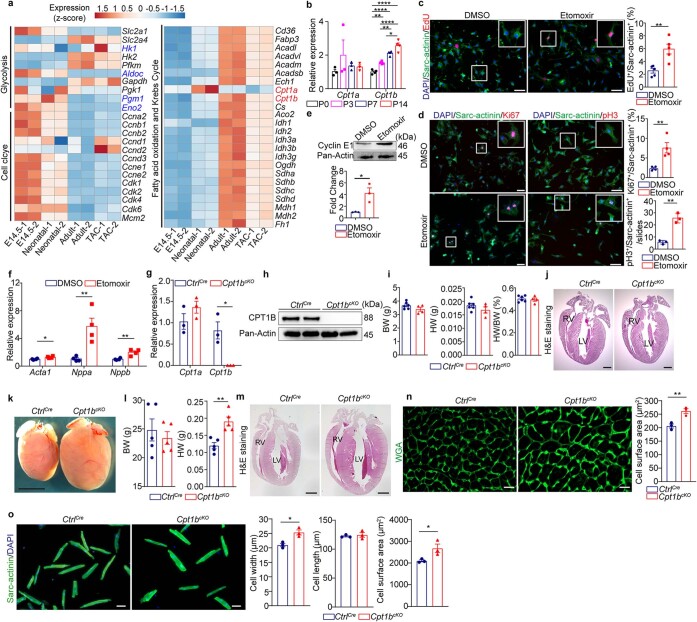
Extended Data Fig. 1. Inhibition of CPT1 stimulates cell cycle activity and hypertrophic growth of neonatal CMs.
a, Heat map representing expression of genes involved in glycolysis, cell cycle, fatty acid oxidation, and the Krebs Cycle. Publicly available RNA-seq data of CMs isolated from mice at E14.5, P1-2, P60, and adult mice one week after transaortic constriction were used (GSE79883). b, RT-qPCR analysis of Cpt1a (n = 3) and Cpt1b (n = 4) expression in mouse hearts at different developmental stages (P0, P3, P7, P14). 36b4 expression served as reference. c, EdU incorporation in neonatal CMs, 72 h after DMSO or etomoxir treatment (n = 5, each). Areas of enlarged images are labelled by white frames. Quantification of EdU+sarc-actinin+ CMs is in the right panel. Scale bar: 50 μm. d, Immunofluorescence staining of neonatal CMs for sarc-actinin and Ki67 (n = 4) or pH3 (Ser10) (n = 3) with or without etomoxir treatment. Quantification of Ki67+sarc-actinin+ and pH3+sarc-actinin+ CMs is in the right panels. Scale bar: 50 μm. e, Western blot analysis of Cyclin E1 in P0-1 CMs after 3-days-culture with DMSO or etomoxir (n = 3, each). Pan-actin served as loading control. f, RT-qPCR analysis of hypertrophy-associated genes in P0-1 CMs, 72 h after DMSO or etomoxir treatment (n = 4, each). 36b4 was used as reference gene. g, RT-qPCR analysis of Cpt1a and Cpt1b expression in CMs from 10-weeks-old CtrlCre and Cpt1bcKO mice (n = 3, each). 36b4 served as reference gene. h, Western blot analysis of CPT1B in CMs from 10-weeks-old CtrlCre and Cpt1bcKO mice (n = 2, each). Pan-actin served as loading control. i, BW, HW, and HW/BW ratios of P7 CtrlCre (n = 6) and Cpt1bcKO (n = 4) mice. j, H&E-stained heart sections from P7 CtrlCre and Cpt1bcKO mice (n = 3, each). Scale bar: 500 μm. k, Images of hearts from 10-weeks-old CtrlCre and Cpt1bcKO mice (n = 3, each). Scale bar: 2 mm. l, BW and HW of 10-weeks-old CtrlCre and Cpt1bcKO mice (n = 5, each). m, H&E staining of heart sections from 10-weeks-old CtrlCre and Cpt1bcKO mice (n = 3, each). Scale bar: 600 μm. n, Immunofluorescence staining for α-WGA and quantification of cell surface areas on heart sections from 10-weeks-old CtrlCre and Cpt1bcKO mice (n = 3, each). Scale bar: 20 μm. o, Immunofluorescence images of sarc-actinin+ CMs from 10-weeks-old CtrlCre and Cpt1bcKO mice (n = 3, each). Quantifications of cell length, width, and surface area are in the right panels. Scale bar: 50 μm. Error bar represents mean ± s.e.m. N-numbers refer to individual mice in b, e-o. N-numbers refer to independent experiments in c, d. Two-tailed, unpaired student t-tests for statistical analysis in c-g, i, l, n-o. One-way ANOVA with Tukey tests for correction of multiple comparisons in b. *P < 0.05, **P < 0.01, ****P < 0.0001. For gel source data in e, h, see Supplementary Information.

