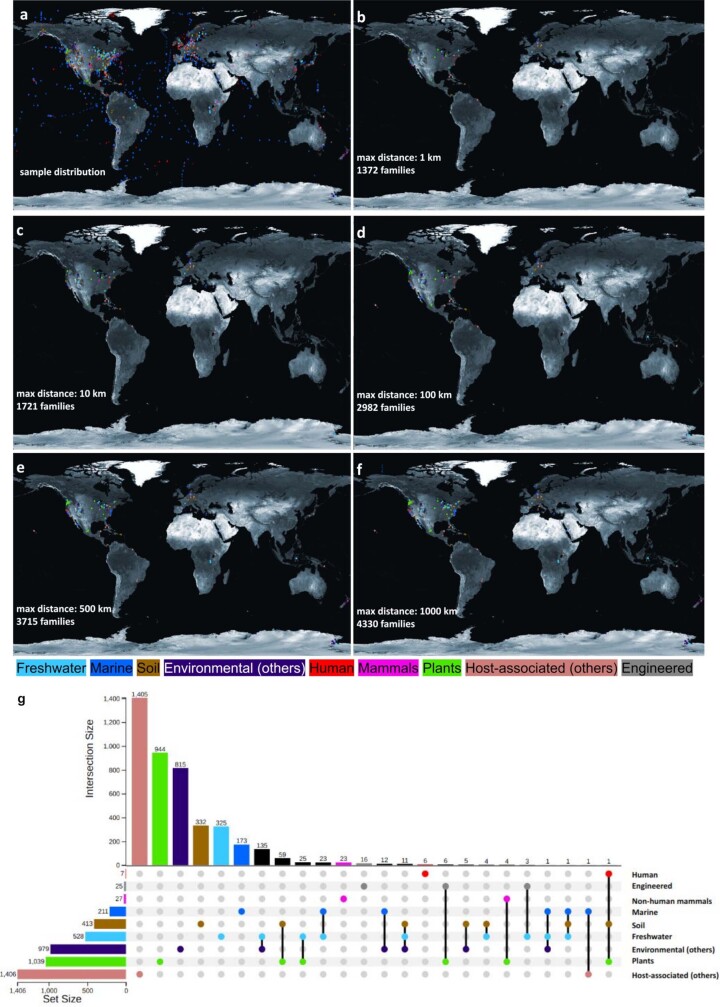
Extended Data Fig. 7. Geographical distribution of the ED samples and NMPFs.
(a) Locations for all ED samples in the study with available geo-location metadata (Longitude and Latitude). (b-f) Distribution of geographically-isolated NMPF clusters, based on a cut-off distance of 1, 10, 100, 500, and 1000 Km. In all cases, dots are coloured based on the ecosystem type (blue: marine, cyan: freshwater, brown: soil, purple: other environmental, green: plants, red: human, magenta: non-human mammals, salmon pink: other host-associated, grey: engineered). (g) UpSet plot showing the distribution of the geographically-isolated NMPF clusters, based on a cut-off distance of 1000 Km (as shown in panel f). Map panels were created using data from the Natural Earth dataset (www.naturalearthdata.com).

