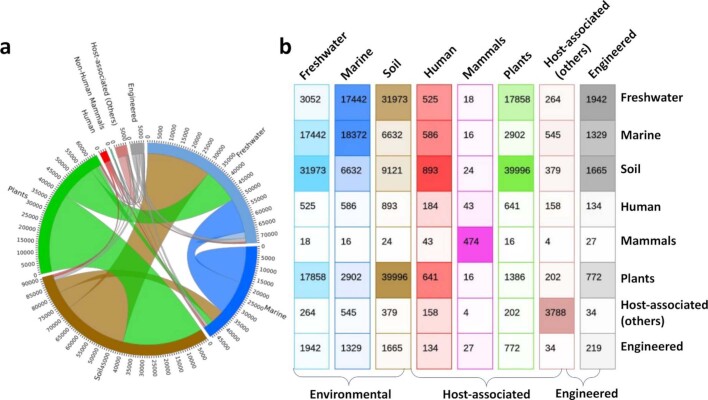
Extended Data Fig. 1. Distribution of NMPF clusters across the eight ecosystem types.
(a) Circos Plot. The distribution of the ecosystems is presented in a chord-like circular diagram. The rim of the diagram represents the total size of the ecosystem types (i.e. number of NMPFs in each ecosystem), with the numbers outside the rim indicating the size scale. The intersections of categories are represented by arcs drawn between them. The size of the arc is proportional to the importance of the flow. (b) 8×8 matrix. Each cell in the matrix presents the common NMPFs in a binary combination of two ecosystems (e.g. 17,442 NMPFs are common among Marine and Freshwater ecosystems). The diagonal of the matrix displays the ecosystem-specific NMPFs. Each ecosystem column is coloured using the same colour code as Fig. 2, with the brightness of each cell being proportional to the NMPF number (brighter colour = less NMPFs).

