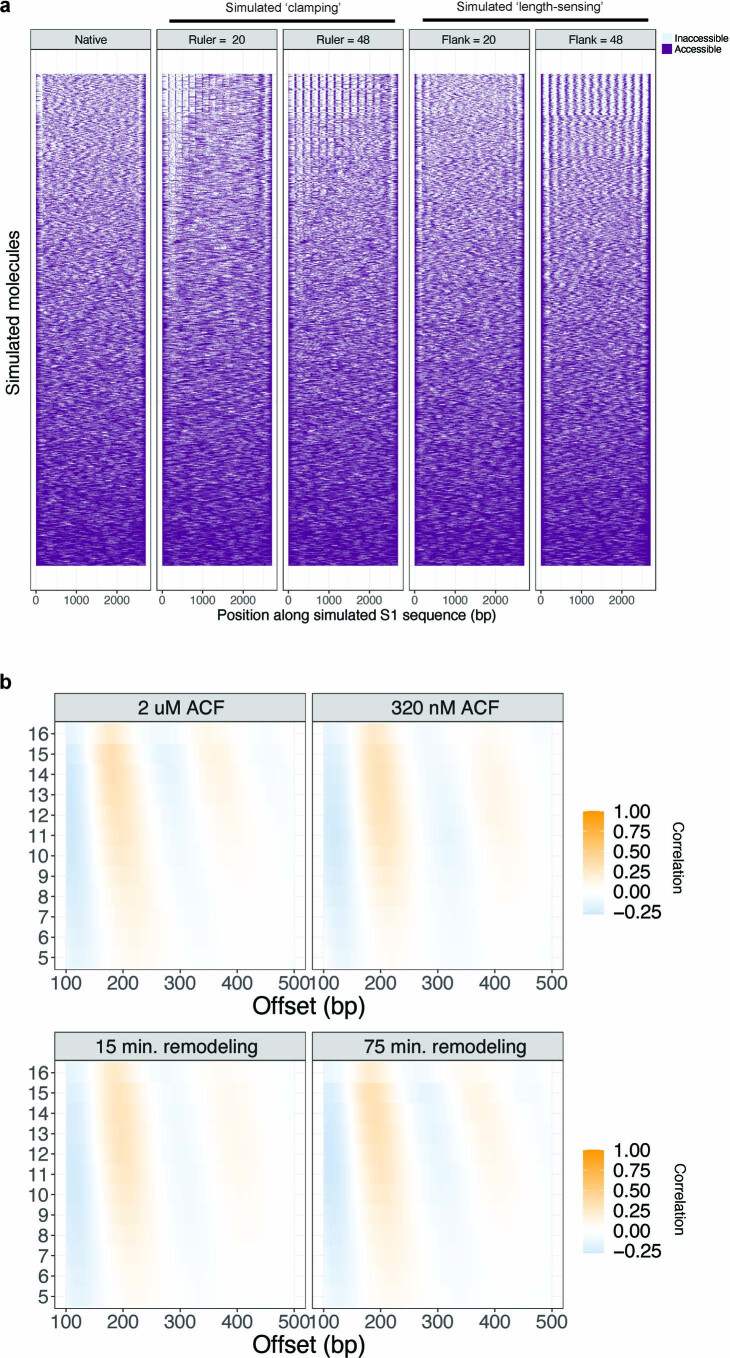
Extended Data Fig. 4. Discerning between models of ISWI remodeling through simulation and additional experimental conditions.
a). Heatmap representation of simulated S1 nucleosomal arrays generated through a Monte-Carlo simulation. Column 1 represents simulated ‘native’ arrays; Column 2 represents simulated ‘clamp’ remodeled arrays with a ruler length of 20 bp; Column 3 represents simulated ‘clamp’ remodeled arrays with a ruler length of 48 bp; Column 4 represents simulated ‘length-sensing’ remodeled arrays with a minimum flanking DNA length of 20 bp; Column 5 represents simulated ‘length-sensing’ remodeled arrays with a minimum flanking DNA length of 48 bp. b). The observation of density-dependent NRL scaling in ACF-remodeled products is neither impacted by ACF: mononucleosome stoichiometry (top) nor remodeling time (bottom).

