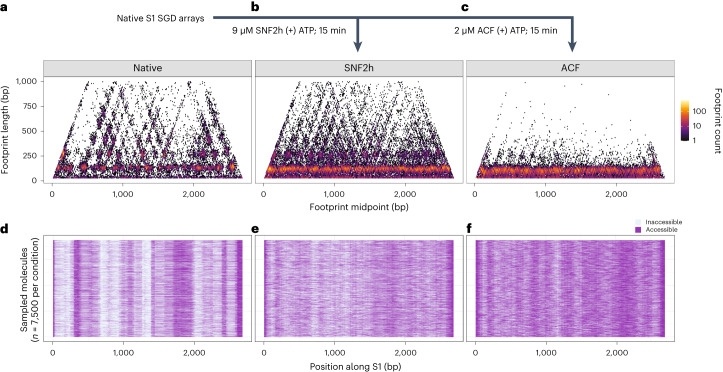
Fig. 3. SAMOSA-ChAAT reveals chromatin remodeling outcomes at single-fiber resolution.
a–c, Footprint length versus footprint midpoint horizon plots comparing native S1 fibers with between 5 and 16 nucleosomes per template (a), S1 fibers remodeled with 9 µM SNF2h for 15 min (b) and S1 fibers remodeled with 2 µM ACF for 15 min (c). d–f, Sampled single-molecule data, with the same experimental conditions as above (with d, e and f corresponding to the conditions in a, b and c, respectively).

