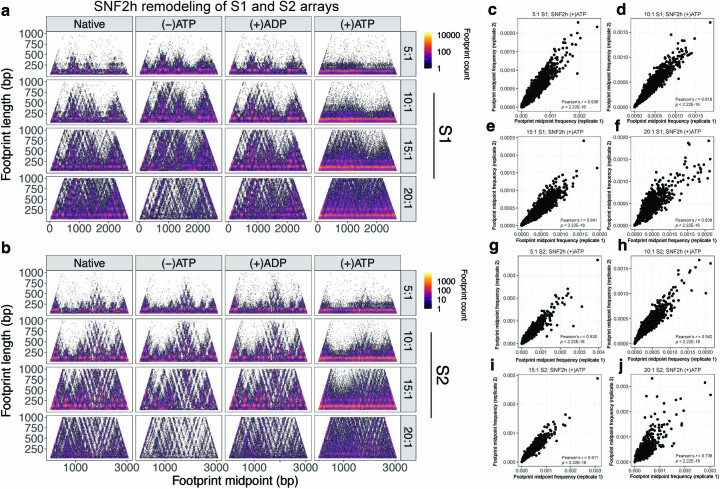
Extended Data Fig. 3. Reproducibility of SAMOSA-ChAAT remodeling experiments and horizon plots for all catalytic conditions tested.
a-b). Horizon plots for S1 (a) and S2 (b) fibers, for native, pre-catalytic, (+)ADP, and remodeled fibers (all averages are over single-turnover experiments; multi-turnover data is omitted for this visualization). c–j). Scatter plots and associated Pearson’s r values for correlations between two biological replicate remodeling experiments, for each density tested, for both S1 (c-f) and S2 (g-j) arrays.

