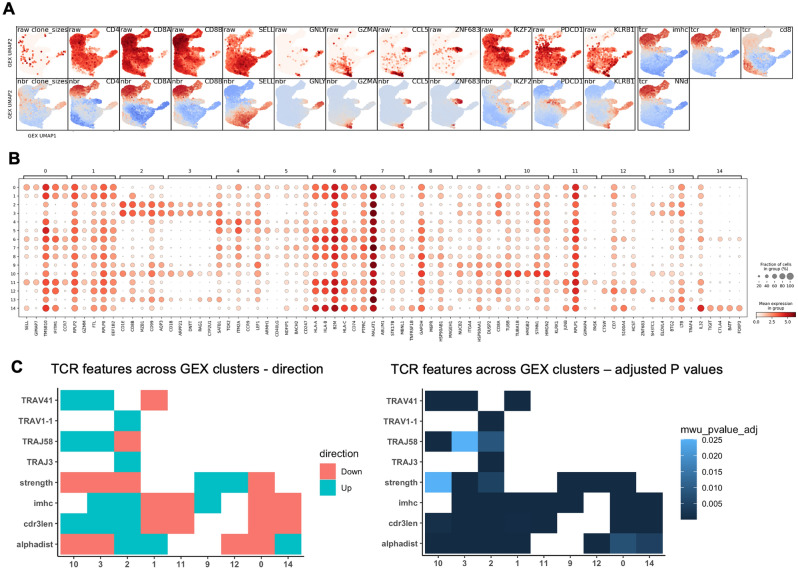
Figure 2.
Gene expression and T cell receptor (TCR) features across single cell gene expression (GEX) defined clusters. (A) Selected genes and TCR features across the thymic GEX UMAP. Colour indicates expression of selected genes (top row) and Z-score normalised and GEX-neighbourhood averaged expression of the same genes (bottom row). Blue colour indicates negative values, red colour indicates positive values. (B) Differentially expressed genes across thymic GEX clusters. Dot colour indicates expression level, and dot size indicates the fraction of clonotypes expressing the gene. (C) Selected TCR features exhibiting variation across GEX clusters in a graph-versus-feature analysis. Numerical features indicating properties of the TCR repertoire are mapped onto a GEX cluster graph where clonotypes residing in the same GEX cluster are connected. Variation in the TCR features across the GEX cluster graph is assessed first by an initial t-test, then by a one-sided Mann–Whitney U test for the features with low t-test P values. Colours indicate direction of change (left) or adjusted Mann–Whitney U test P values (right).

