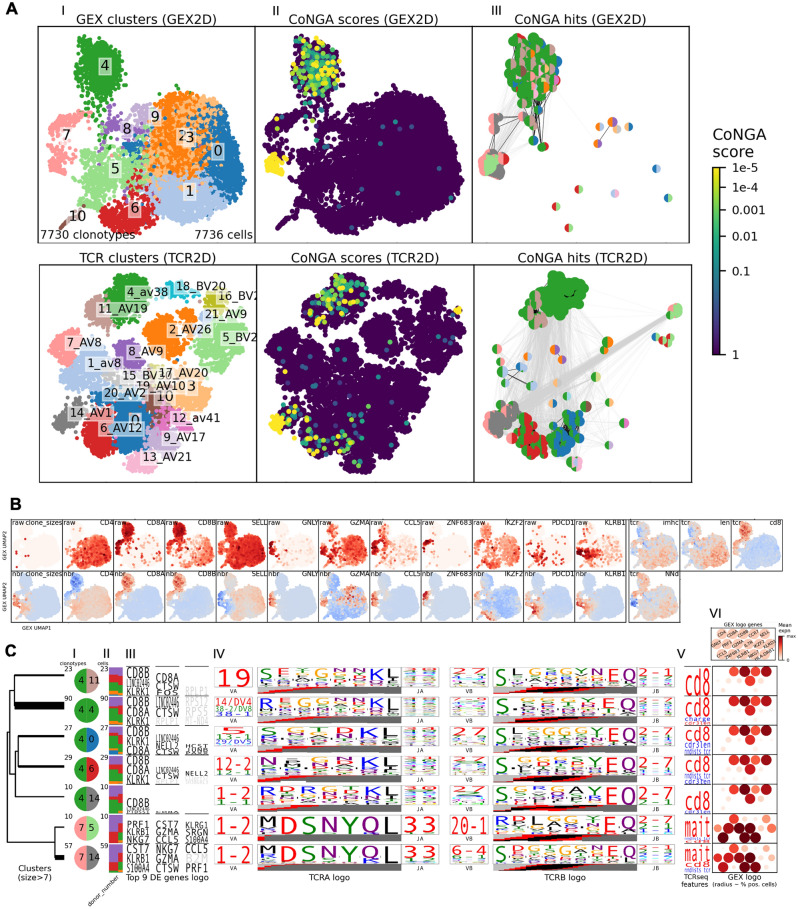
Figure 4.
Clonotype Neighbour Graph Analysis (CoNGA) for identification of correlations between peripheral T cell gene expression (GEX) and T cell receptor (TCR) datasets (N = 5). (A) (I) UMAP projections coloured by GEX (top row) and TCR (bottom row) clusters. (II) UMAP projections coloured by “CoNGA scores”, indicating clonotypes residing in overlapping neighbourhoods in both the GEX and TCR datasets. (III) Bi-coloured discs indicating the GEX (left half) and TCR (right half) cluster assignment of clonotypes with low “CoNGA scores” (“CoNGA hits”). (B) Raw and Z-score normalised and GEX-neighbourhood averaged (nbr) expression of selected genes and TCR features across the thymic GEX UMAP. Blue colour indicates negative values, red colour indicates positive values. (C) Gene expression and TCR features among clonotypes grouped into “CoNGA clusters”. Shown are (I) bi-coloured discs indicating GEX (left half) and TCR (right half) cluster assignment, (II) donor origin of clonotypes, (III) differentially expressed genes, (IV) frequently used TCR gene segments and amino acid sequences, (V) properties of the TCR repertoire (represented as numerical TCR feature scores, red colour indicates increased scores, blue colour indicates decrease scores), and (VI) expression of selected genes.

