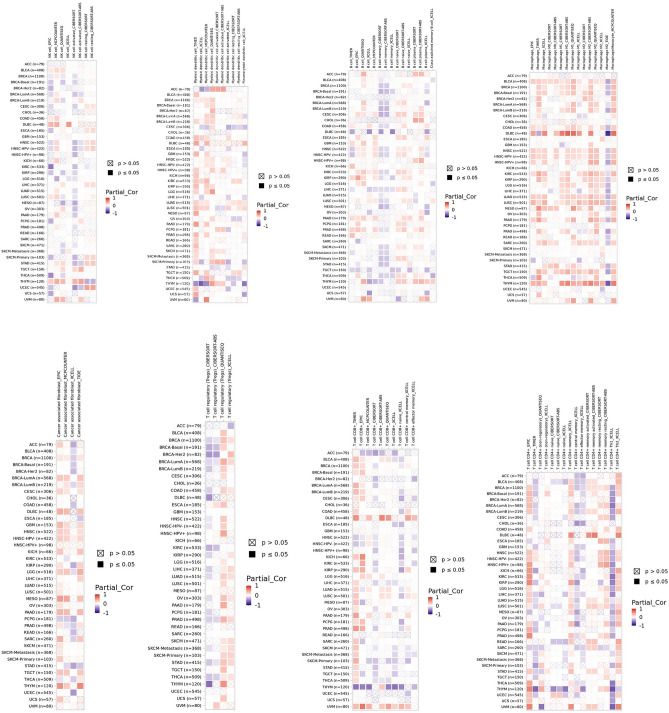
Figure 6.
The relationship between SLC31A1 expression and immune cells infiltration. Immune cells, including NK cell, Myeloid Dendritic cell, B cells, Macrophages, Cancer associated fibroblasts, Treg cells, CD8 + T cells and CD4 + T cells. Positive correlation (0–1) are indicated with the red color, while negative correlation (− 1 to 0) are indicated with the blue color. p-value < 0.05 is considered as statistically significant. A cross indicates non-significant correlations. TIMER2.0 was used (Version: 2.0 and link: http://timer.cistrome.org/).

