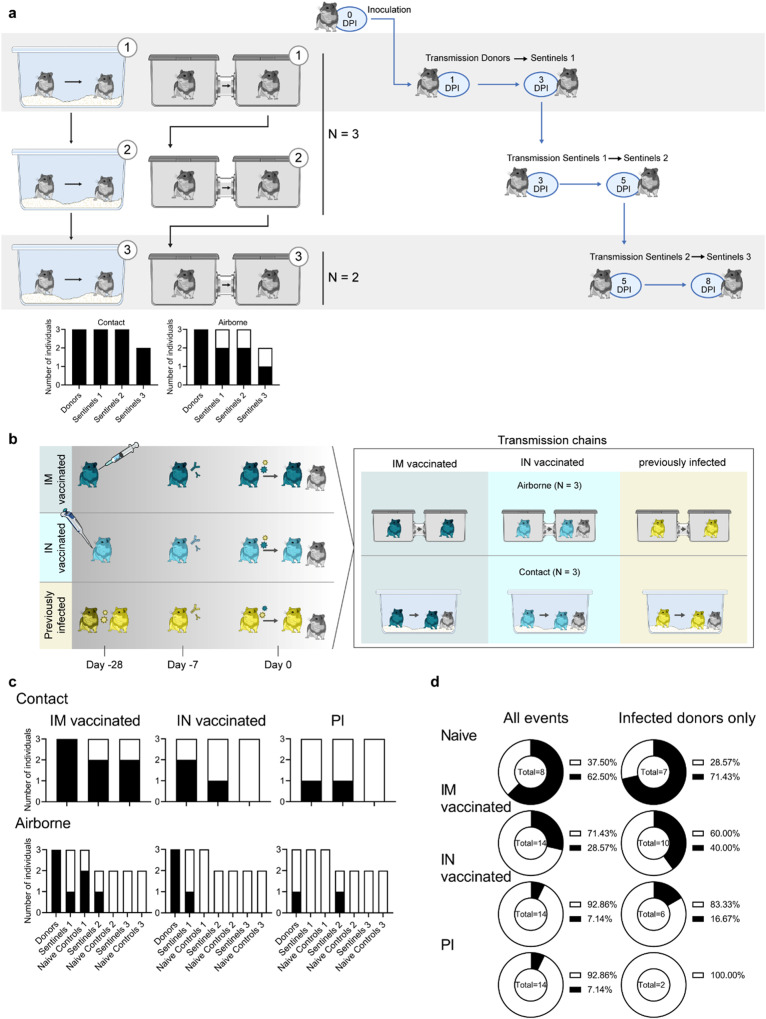
Fig. 2. Transmission competitiveness of Delta B.1.617.2 and Omicron B.1.1.529 in a naïve, vaccinated, or previously infected hamster population.
a Transmission efficiency in naïve hamsters; schematic. Summary of infection status for the donors and sentinels. Oropharyngeal swabs were taken on 2, 3, and 5 days post infection/exposure (DPI/DPE), and lungs and nasal turbinates were collected at day 5 DPI/DPE. Bar charts depict summary of individuals, divided into contact and airborne chains. b Transmission efficiency in hamsters with pre-exiting immunity, schematic. Hamsters were either vaccinated intramuscularly (IM, dark blue) or intranasally (IN, light blue) against Lineage A or experienced a previous infection with Delta B.1.617.2 through contact exposure to IN inoculated hamsters (PI, yellow). Donor animals (N = 6 for each group) were inoculated with a total of 104 TCID50 of Delta B.1.617.2 and Omicron B.1.1.529 via the IN route (1:1 ratio), and sentinels 1 (N = 6) were exposed 24 h later. c Summary of infection status for donors and sentinels. Oropharyngeal swabs were taken on 2, 3, and 5 DPI/DPE, and lungs and nasal turbinates collected at 5 DPI/DPE. Bar charts depict summary of individuals, divided by contact and airborne chains. d Pie charts summarizing transmission efficiency between naïve, IM vaccinated, IN vaccinated, and PI hamsters across all possible airborne transmission events (left) and events for which the donor animal was confirmed infected (2 out of 5 samples positive by sgRNA qRT PCR (>10 copies/rxn) (right)). Number of events is indicated within each pie chart. Pie chart colors: Black = transmission, white = no transmission. Source data are provided as a Source Data file.

