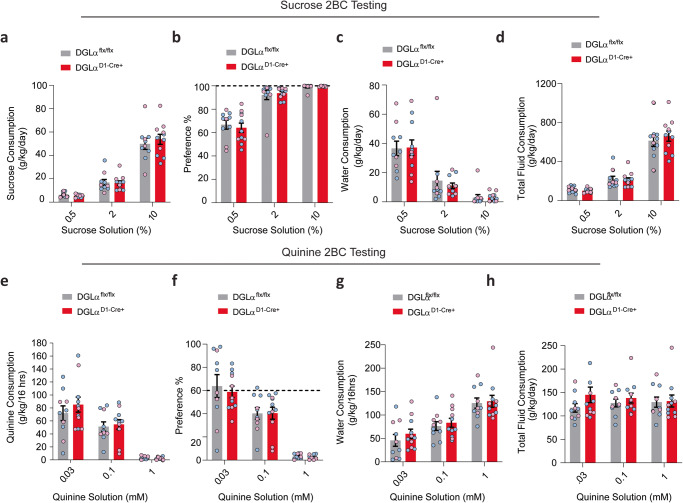
Fig. 5. DGLα D1 Cre+ knockout mice display similar taste preference and aversion for sweet- and bitter-flavored solutions.
Summary bar graph depicting DGLα flx/flx mice in gray and DGLα D1 Cre+ mice in red. Individual differences between males (blue circles) and female (pink circles) are shown. a Sucrose consumption, (b) preference, (c) water consumption, and (d) total fluid consumption during two bottle choice testing for increasing concentration of sucrose solutions. e Quinine consumption, (f) preference, (g) water consumption, and (h) total fluid consumption during quinine two bottle choice testing. All data reported as mean ± SEM.

