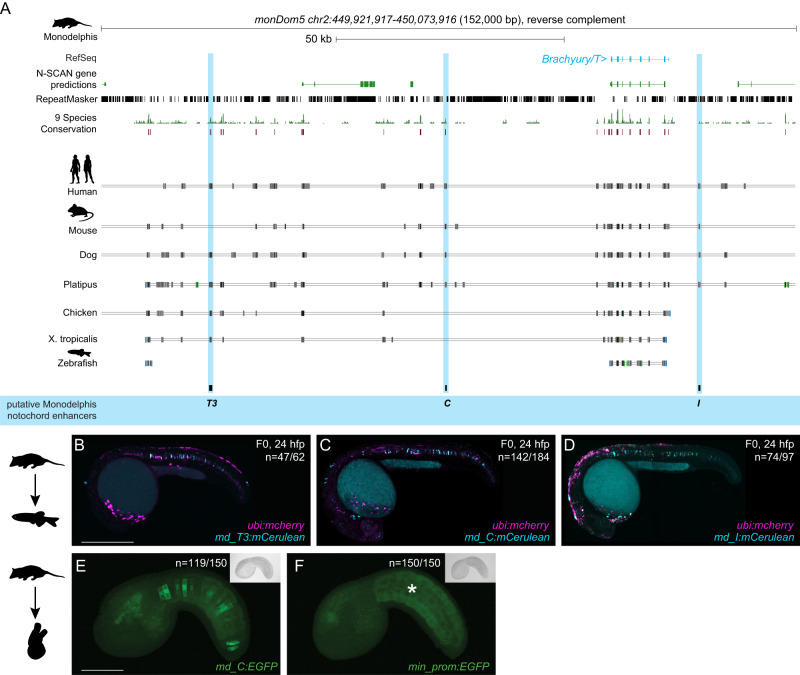
Fig. 4. Monodelphis Brachyury enhancer elements are active in different species.
A Monodelphis Brachyury/T/TBXTB locus adapted from the UCSC genome browser. Repeats are marked in black using the RepeatMasker track. Further annotated are tracks containing N-SCAN gene predictions and 9 Species Conservation. The light blue highlighted boxes mark the Monodelphis enhancer elements T3, C and I and their conservation in other species. B–D Representative F0 zebrafish embryos injected with the Monodelphis enhancer elements md_T3 (B), md_C (C), and md_I (D) showing mosaic mCerulean reporter expression in the zebrafish notochord at 24 hpf. ubi:mCherry was used as injection control. N represent the number of animals expressing mCerulean in the notochord relative to the total number of animals expressing mCherry. Scale bar in (B): 0.5 mm, applies to (B, C). E, F Representative images of Ciona embryos electroporated with Monodelphis enhancer element md_C (E), and minimal forkhead promoter (fkh) only as control (F). Monodelphis enhancer element md_C expresses EGFP throughout the entire Ciona notochord, compared to minimal fkh promoter only which does not express EGFP at all (asterisk in F). N represent the number of animals expressing EGFP in the notochord relative to the total number of animals. Inserts on the top right represent bright field images of respective embryos. Scale bar in (E): 0.05 mm, applies to E, F. The species silhouettes were adapted from the PhyloPic database (www.phylopic.org).

