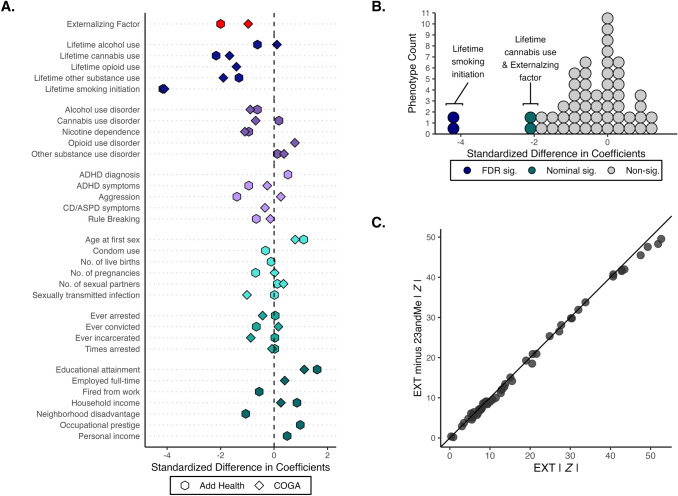
Fig. 4.
Comparison of the down-sampled polygenic score (PGS) analyses in Add Health (29 phenotypes) and the Collaborative Study on the Genetics of Alcoholism (COGA; 26 phenotypes). Panel A displays the standardized difference between the coefficient estimates (i.e., a Z-statistic) of the down-sampled PGS for EXT-minus-23andMe versus the PGS for EXT from the original study. Absolute values were evaluated so that a negative standardized difference refers to an attenuation towards zero in the down-sampled analysis. Panel B displays the same measure but as a histogram. Four coefficient estimates were significantly (at the 5% level) attenuated in the down-sampled analysis: lifetime smoking initiation (Add Health and COGA; P = 3.18 × 10⁻⁵ and 4.17 × 10⁻⁵, respectively), the phenotypic externalizing factor (Add Health; P = 0.046), and lifetime cannabis use (Add Health, P = 0.03). None of the coefficients were significantly larger in the down-sampled analysis. Panel C displays a scatter plot of the absolute value of the coefficient estimates divided by their respective standard errors (i.e., a Z-statistic). These results are also reported in Table S6

