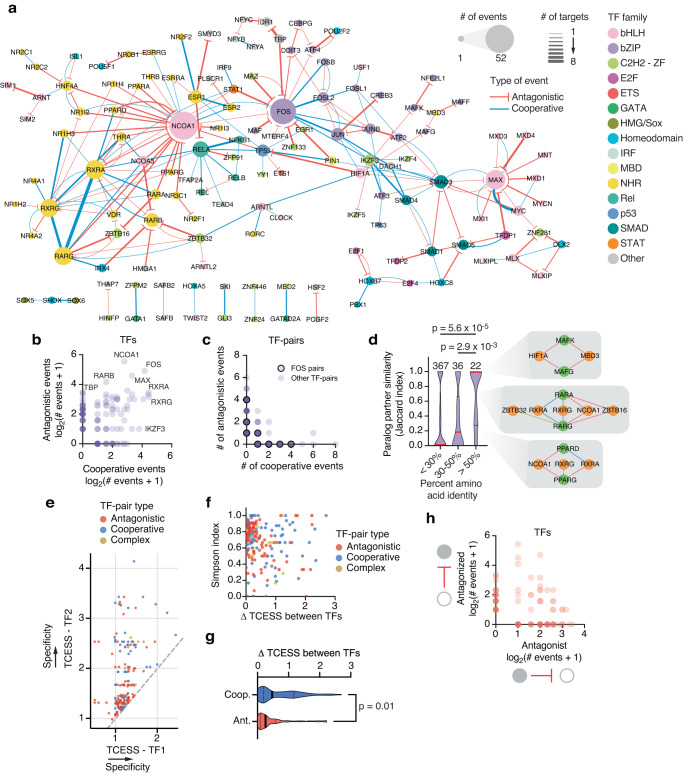
Fig. 3. pY1H maps cooperative and antagonistic relationships between TFs.
a Network of cooperative and antagonistic relationships between TFs at cytokine promoters screened. Node size indicates the number of binding events for that TF. Edge width represents the number of cooperative or antagonistic events involving a specific TF-pair. b Number of cooperative and antagonistic events observed for individual TFs. c Number of cooperative and antagonistic events observed for TF-pairs. FOS-containing pairs are outlined in black. d Similarity in cooperative and antagonistic relationships with shared TF partners (Jaccard index) between paralogs. Significance determined by two-tailed Mann–Whitney’s U-test. Numbers above each column reflect the number of TF paralog pairs assessed in each group (n = 367 TF paralog pairs with <30% amino acid identity, n = 36 TF paralog pairs with 30%−50% amino acid identity, and n = 22 TF paralog pairs with >50% amino acid identity). Red dividing lines within each violin plot represent the median, and black lines represent the top and bottom quartiles. Insets show relationships between paralog-pairs (green) with partners (orange). Edges in red, blue, and gold indicate antagonistic, cooperative, and complex relationships, respectively. e Tissue/cell-type expression specificity score (TCESS) for TFs in pairs showing cooperativity, antagonism, or both (complex). For each TF-pair, the larger TCESS value was plotted on the y-axis. f Scatter plot showing the Simpson co-expression similarity and the difference in TCESS for each TF-pair showing cooperativity, antagonism, or both (complex). g Difference in TCESS between TFs in cooperative TF-pairs (n = 72 pairs) and antagonistic TF-pairs (n = 93 pairs). Significance by two-tailed Mann–Whitney’s U-test. Solid dividing lines within each violin plot represent the median, and dashed lines represent the top and bottom quartiles. h Number of antagonistic events in which each TF acted as the “antagonist TF” or “antagonized TF”. Source data are provided as a Source Data file.

