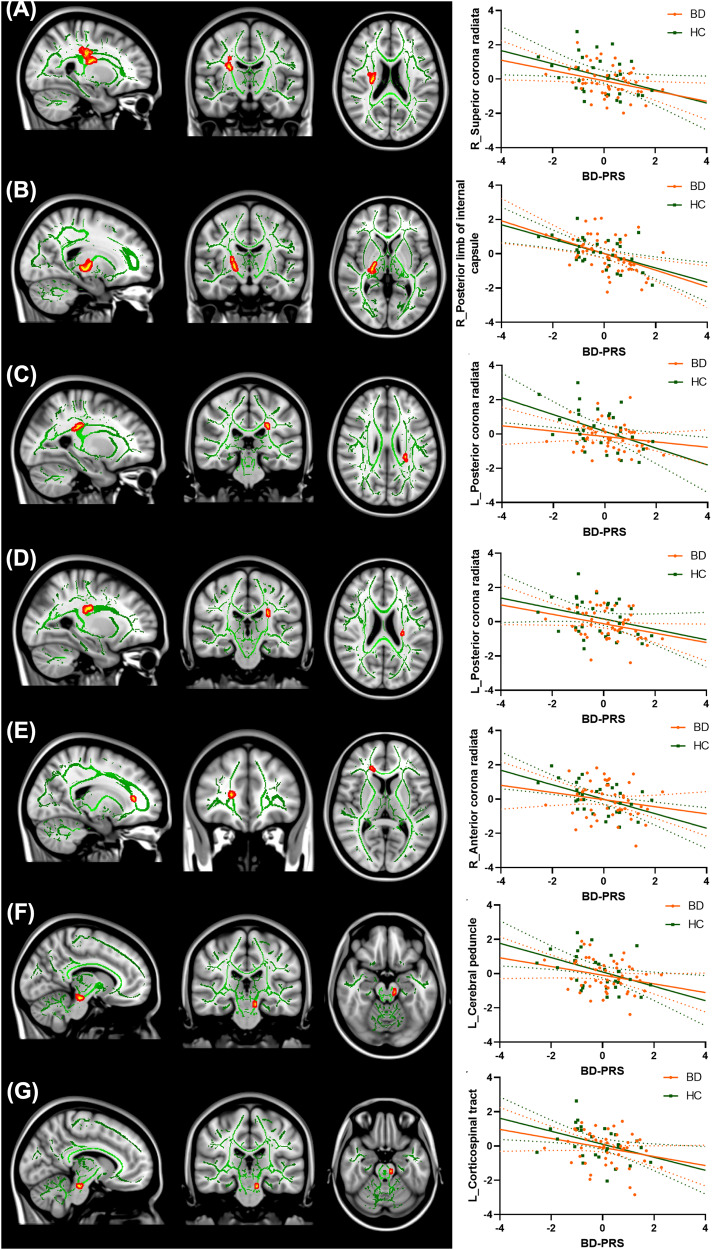
Fig. 4. Association between BD-PRS and FA values of significant clusters identified in the combined sample of BD and HC.
Higher BD-PRS was associated with lower FA in (A) right superior corona radiata, (B) right posterior limb of internal capsule, (C) left posterior corona radiata, (D) left posterior corona radiate, (E) right anterior corona radiata, (F) left cerebral peduncle, and (G) left corticospinal tract. The y-axis is labeled by the main region of significant clusters, and the value on y-axis indicates the standardized residuals of FA values of the significant clusters, adjusted for age, sex, and two genetic principal components.

