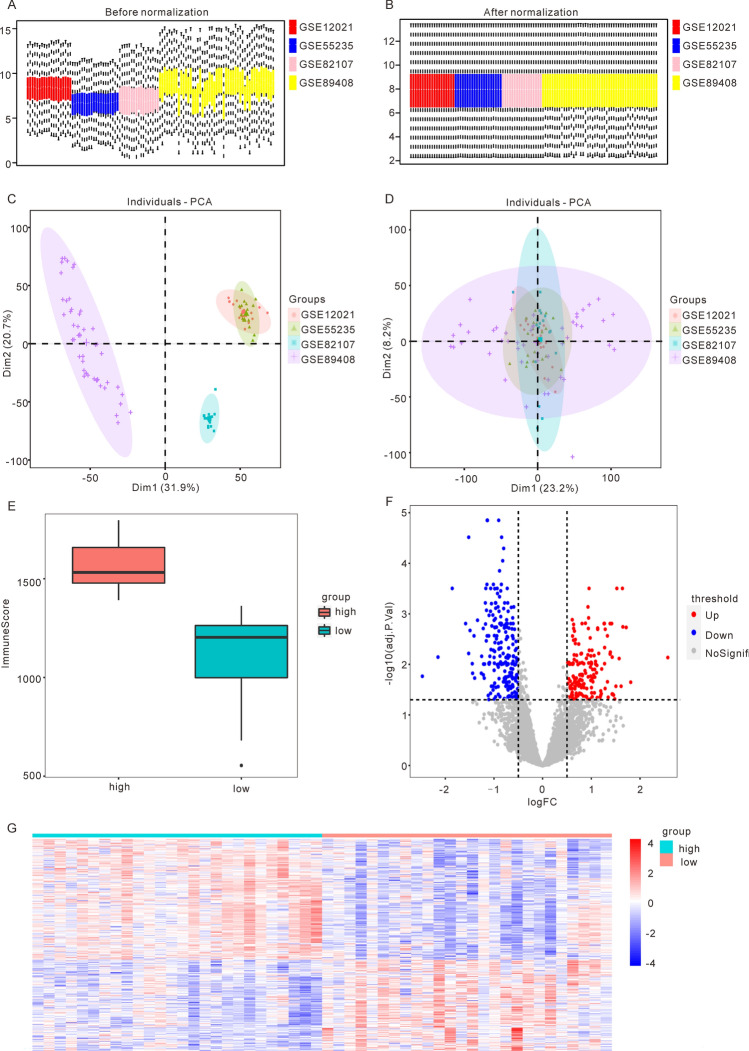
Figure 1.
Identification of differentially expressed genes based on the merged osteoarthritis (OA) dataset. (A) boxplot of OA datasets before standardization. (B) boxplot of OA datasets after standardization. (C) PCA plot of OA datasets before batch effect removal. (D) PCA plot of OA datasets after batch effect removal. (E) Distribution of ImmuneScore in High ImmuneScore and Low ImmuneScore groups in OA samples. (F) The volcano map showed the results of differentially expression analysis, with 160 up-regulated genes and 212 down-regulated genes (red represents up-regulated expression, blue represents down-regulated expression). (G) The heatmap shows the expression of DEGs between the High ImmuneScore group and the Low ImmuneScore group. (OA: osteoarthritis).

