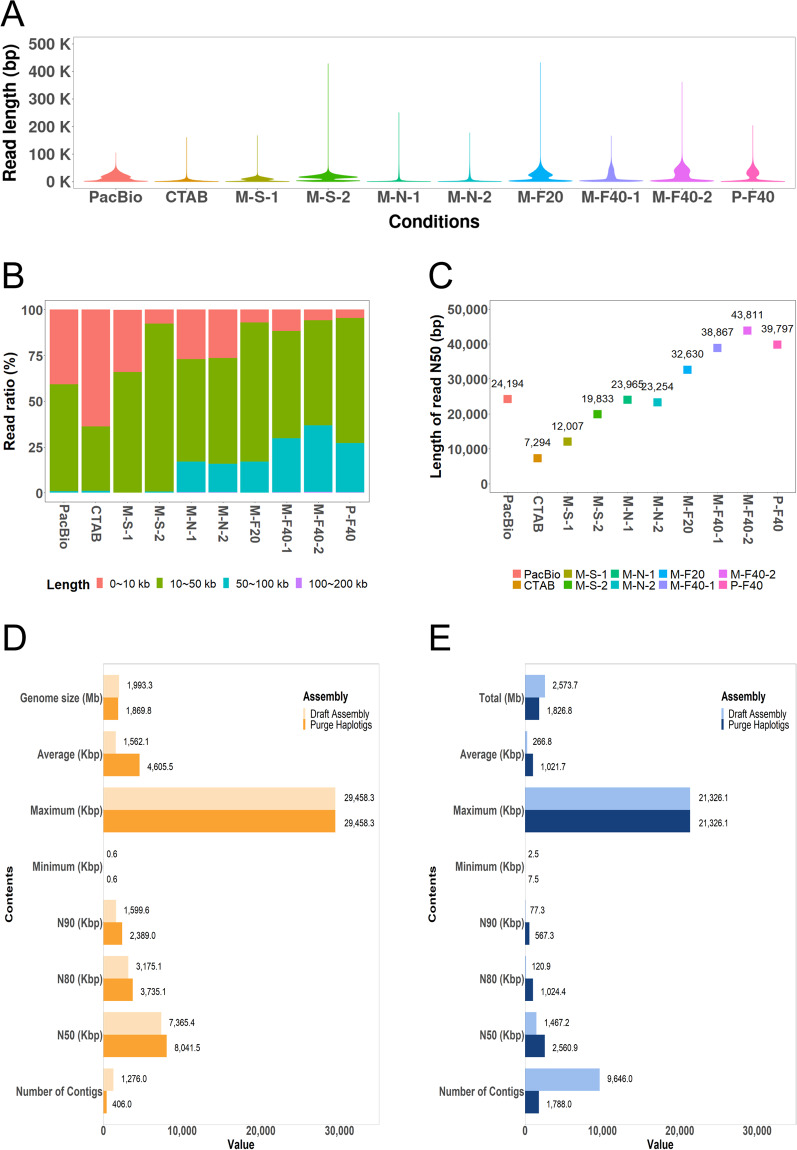
Fig. 1.
Distribution of raw reads from long read sequencing and genome assembly. (A) Read distributions from each sequencing batch. The x-axis indicates Nanopore sequencing batch, and the y-axis indicates read length. M, MinION; P, PromethION; S, sheared; N, non-sheared; F20, 20 kb size fractionation; F40, 40 kb size fractionation. (B) Read length ratio for each sequencing batch. The x-axis indicates ratio of read length, and the y-axis indicates sequencing batch. (C) Read N50 values for each sequencing batch. (D,E) Genome assembly improvements by Purge Haplotigs with ONT (D) and PacBio (E). The x-axis indicates value of parameters, and the y-axis indicates genome quality parameters.

