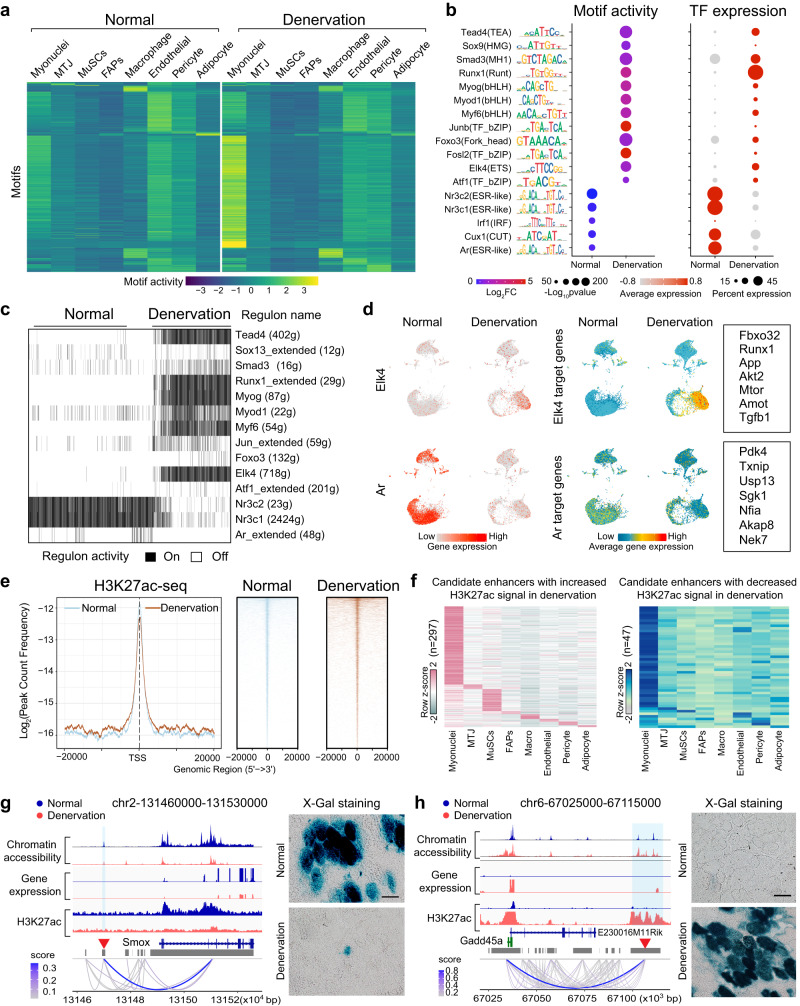
Fig. 4. Cis-regulation rewiring in denervated muscle.
a Heatmap (Z-score) illustrates average chromVAR motif activity for each cell type in both normal and denervated muscles. Refer to Supplementary data 4 for atrophy-related motifs and their best-matched TFs specific to each cell type. b Dot plots display the differential motif activities (left) and corresponding TF expression (right) in normal and denervated myonuclei. Significance was evaluated with a Wilcoxon Rank Sum two-side test, n = 3 mice per group containing 14,388 nuclei in a joint analysis. c Heatmap presents select myonuclei-specific regulon activities in normal and denervated muscles, as identified by intersecting ChromVar and SCENIC results. The comprehensive list of TFs (regulons) is available in Supplementary data 5. The SCENIC algorithm binarized regulon activity as “On” (black) or “Off” (white). d UMAP plots showcase the upregulation of Elk4 and its target genes (upper), or the downregulation of Ar and its target genes (lower) in response to denervation. e H3K27ac ChIP-seq profile of normal and denervated muscles. Left: the read count frequency in selected range around TSS. Right: heatmaps of normalized H3K27ac tag densities at differentially H3K27-acetylated regions. f Heatmap displays candidate enhancers with either increased (left) or decreased (right) H3K27ac signals in denervated muscles. For a complete list of inferred candidate enhancers, refer to Supplementary data 6 and 7. g, h Left: Fragment coverage tracks showing chromatin accessibility, gene expression, and H3K27ac ChIP-seq signals. Red arrowhead indicates the tested regions of enhancers. Right: Representative image of in vivo enhancer activity visualized by X-Gal staining in tibialis anterior (TA) muscles from 3 normal and 3 denervated mice. Scale bar: 50 μm. Source data are provided as a Source data file.

