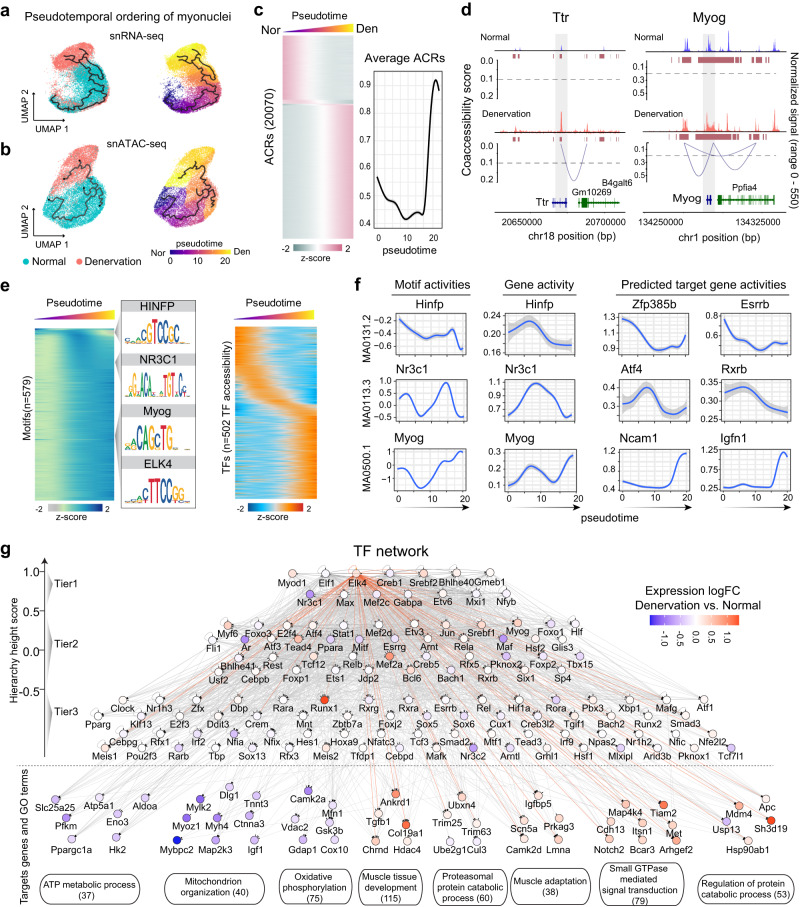
Fig. 5. Dynamic chromatin accessibility and TF network in denervated myonuclei.
a UMAP of mRNA profile illustrating transition trajectory from normal to denervated myonuclei (left) and pseudotime progression (right). Nor: normal, Den: denervation. b UMAP of ACRs profile depicting transition trajectory and pseudotime from normal to denervated myonuclei. c Left heatmap showing relative accessibilities of 20,070 pseudotime depended ACRs, average of ACRs accessibility across pseudotime is shown on the right (p < 0.01, significance was evaluated with a Benjamini-Hochberg-adjusted regression analysis). d Fragment coverage tracks showing chromatin accessibility and co-accessibility links in normal and denervated myonuclei. The region of increased accessibility in denervated muscle is shaded in gray. e Relative motif activities for 579 TF motifs (left) and their corresponding TFs’ expression (right) across pseudotime. Four examples of enriched motifs are shown in the middle. f Line plots illustrating the dynamic changes of chromatin accessibility in selected in TFs (left), motif activity (middle), and activities of target genes (right) from GAS muscles of 3 normal and 3 denervated mice. Shadow represents the 95% confidence interval of local polynomial regression fitting. g Gene regulatory network with TF hierarchy in denervated muscle. TFs are stratified into three tiers by hierarchy height score. Target genes are grouped by terms of GO enrichment. For detailed hierarchy height and GO terms, see Supplementary data 8.

