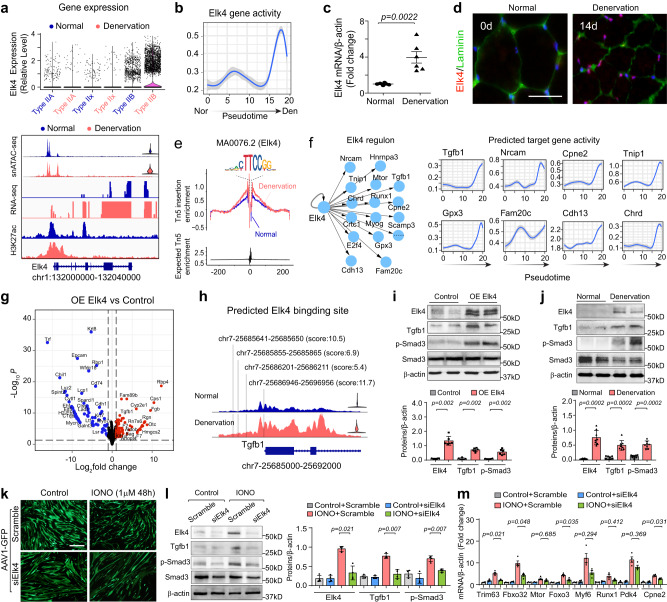
Fig. 6. Elk4 regulates myotube atrophy through TGFB1.
a Upper: Violin plot of Elk4 expression across myonuclei types. Lower: Tracks show chromatin accessibility, Elk4 expression, and H3K27ac profile at the Elk4 locus. b Line plots track Elk4 activity dynamics from normal to denervation. The solid line represents the Local Polynomial Regression fit, with the shaded region indicating the 95% confidence interval. c Quantitative RT-PCR analysis of Elk4 mRNA in normal and denervated GAS muscle (n = 6). d Immunofluorescence staining of Elk4 in normal and denervated GAS muscle. Scale bar: 25 μm. e TF footprinting plot demonstrating Elk4 motif activity in normal and denervated myonuclei. f Transcriptional network map of Elk4 regulons (left) and line plots of gene activity dynamics for Elk4 target genes across pseudotime. g Volcano plot of transcriptomic changes in C2C12 cells post Elk4 overexpression. Red and blue dots signify up- and down-regulated genes with log2-fold change thresholds of ±1 and p-value < 0.05, analyzed using a two-sided Fisher’s exact test in EdgeR v3.12.1. h Fragment coverage plot showing Elk4 motif within the promoter region (2000bp from TSS) of the Tgfb1 locus. Predicted scores are shown in parentheses. i Immunoblotting and quantitative analysis of ELK4, TGFB1, and p-SMAD3 in C2C12 cells with or without Elk4 overexpression (n = 6). j Immunoblotting and quantitation of ELK4, TGFB1, and p-SMAD3 in normal and denervated GAS muscle (n = 8). k Fluorescence images displaying changes in C2C12 myotubes (transfected with AAV1-Scramble-GFP or Elk4 siRNA-GFP) in response to ionomycin (IONO, 1 mM, 48 h). Scale bar: 50 μm. l Immunoblotting (left) and quantitative analysis (right) of ELK4, TGFB1, and p-SMAD3 for experiments in (k) (n = 4). m Quantitative RT-PCR analysis of atrophy-related genes in normal or ionomycin-treated C2C12 myotubes with or without Elk4 knockdown (n = 4). All bar graphs present quantitative data as mean ± SEM. “n” denotes the number of biological replications (i, l, m) or mice/group (c, j). Significance was assessed using a two-side Wilcoxon rank-sum test (c, i, j) or two-side one-way ANOVA with post hoc Tamhane’s multiple comparisons test (l, m). Source data are provided as a Source data file.

