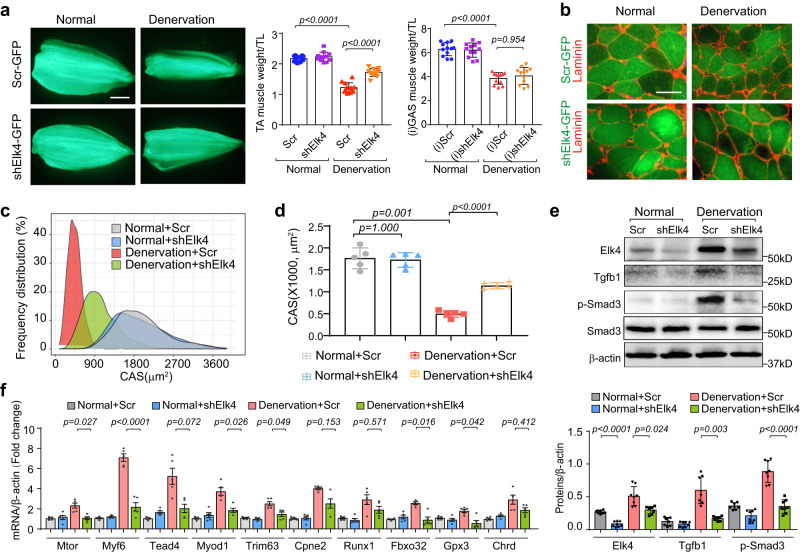
Fig. 7. Elk4 inhibition attenuates muscle atrophy induced by denervation.
a Left: Fluorescence images of TA muscles transfected with pAAV-GFP plasmid containing either scramble (Scr) shRNA or a combination of three pAAV-GFP plasmids each with a specific Elk4-targeting shRNA. Middle: Scatter-bar plot comparing the weight of transfected TA muscles. Right: Scatter-bar plot of the weight of ipsilateral (non-transfected) GAS muscles 14 days post-denervation. Data are presented as mean ± SEM (n = 12 mice/group). Significance was determined by two-sided one-way ANOVA with post hoc Tamhane’s multiple comparisons test. Scale bar: 2 mm. b Cross-sectional images corresponding to samples in (a). “CSA” indicates the cross-sectional area. Scale bar: 25 μm. c Distribution of myofiber sizes derived from the samples in (b). d Quantitative analysis of the cross-sectional area based on the samples from (b). Data are presented as mean ± SEM (n = 5 mice/group, significance was determined by two-sided one-way ANOVA with post hoc Tamhane’s multiple comparisons test). e Western blot analysis (left) and its quantification (right) using samples from (a). Data are shown as mean ± SEM (n = 8 mice/group, significance was determined by two-sided one-way ANOVA with post hoc Tamhane’s multiple comparisons test). f Quantitative RT-PCR analysis of atrophy-related genes in TA muscle, comparing normal versus denervated conditions with or without Elk4 knockdown. Data are presented as mean ± SEM (n = 5 mice/group, significance was determined by two-side one-way ANOVA with post hoc Tamhane’s multiple comparisons test). Source data are provided as a Source data file.

