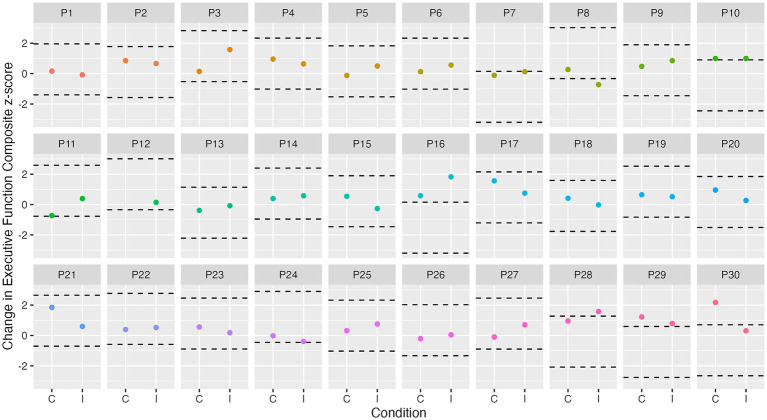
Figure 4.
Individual change in executive function from baseline to immediately post-intervention. Dashed lines represent ± SDCind (z-score of 1.7) for executive function from each participant’s best baseline executive function score. C, control condition; I, intervention condition; P, participant number.

