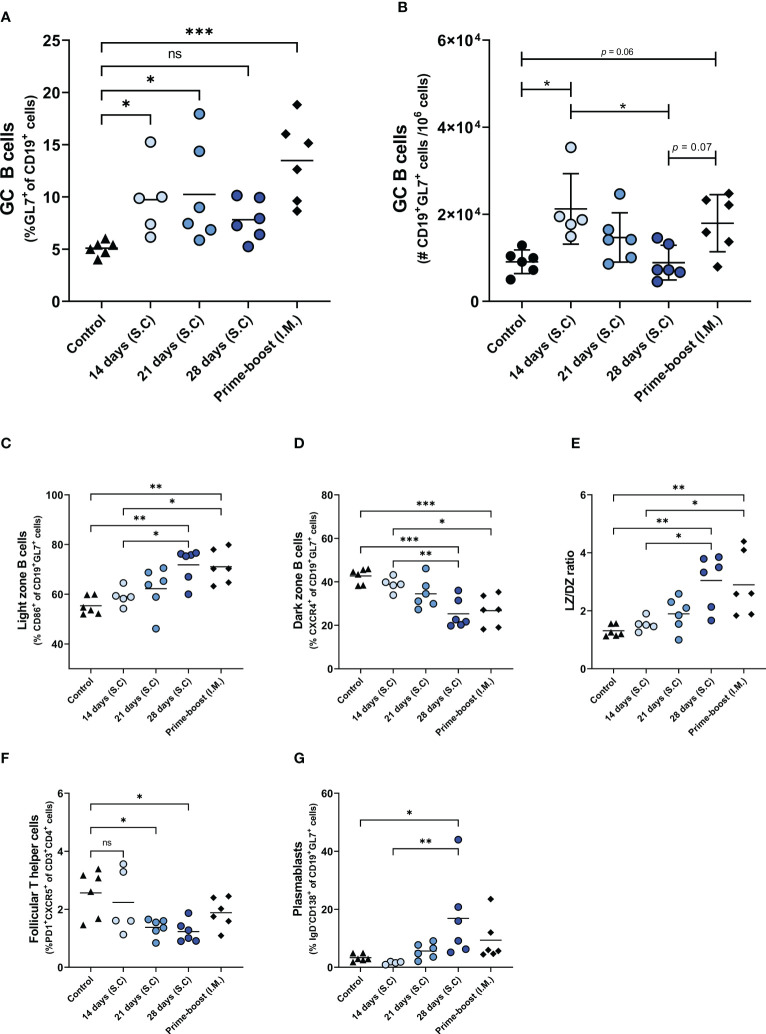
Figure 4.
Germinal center reactions. GC reaction in lymph nodes of mice, immunized as described in the legend of Figure 1 , were assessed by measuring the frequency (A) and absolute number (B) of CD19+GL7+ BGC cells, the frequencies of CD19+GL7+CD86+ light zone BGC cells (C), CD19+GL7+CXCR4+ dark zone BGC cells (D), and ratio of light zone B cells/dark zone B cells (E), CD3+CD4+PD1+CXCR5+ TFH cells (F), and CD19+GL7+IgD-CD138+plasmablasts (G). Statistical comparisons between experimental groups were done using one-way ANOVA with Tukey post-hoc test (* p < 0.05, ** p < 0.01, *** p < 0.001). BGC, germinal center B; DZ, dark zone; GC, germinal center; TFH, Follicular T helper; LZ, Light zone; ns, not significantly different.

